_1770677325GS4sO.jpg)
Aus Investment Properties Australia's Quarterly Report – December 2024
1. Introduction
This report provides a comprehensive analysis of trends in construction and land costs across Australia from December 2023 to December 2024. It is designed to help investors understand changes in the property market, particularly in the context of turnkey investment properties. Turnkey properties, which are fully completed and ready for tenants, offer investors the advantage of immediate rental income and minimal management efforts.
2. Data Sources
This report is based on data from:
-
December 2023: Contextual information from property listings at AusInvestmentProperties.com.au
-
December 2024: Detailed data on construction and land costs per square meter, categorised by property type and location.
3. Nationwide Trends
Construction Costs per Square Meter (m²) by Property Type
|
Property Type |
Dec 2023 Avg (AUD/m²) |
Dec 2024 Avg (AUD/m²) |
% Change |
|
All Property Types |
$2,500 |
$2,700 |
+8.0% |
|
Co-Living |
$2,700 |
$2,950 |
+9.3% |
|
Dual Occupancy |
$2,650 |
$2,850 |
+7.5% |
|
Rooming House |
$2,300 |
$2,450 |
+6.5% |
|
Terrace/Villas |
$2,750 |
$3,000 |
+9.1% |
|
Apartment |
$3,000 |
$3,200 |
+6.7% |
|
Duplex |
$2,800 |
$2,950 |
+5.4% |
|
House and Land |
$2,500 |
$2,680 |
+7.2% |
|
Dual Key |
$2,600 |
$2,750 |
+5.8% |
|
SDA |
$3,200 |
$3,450 |
+7.8% |
|
SMSF |
$2,600 |
$2,800 |
+7.7% |
|
Town House/Unit |
$2,700 |
$2,880 |
+6.7% |
Key Observations:
-
Co-Living and Terrace/Villas experienced the highest increase, reflecting growing demand for affordable shared accommodation and compact housing.
-
SDA properties remain among the most expensive to build due to specialised requirements.
Property Trends by State and Property Type
New South Wales
|
Property Type |
Dec 2023 Avg (AUD/m²) |
Dec 2024 Avg (AUD/m²) |
% Change |
|
Co-Living |
$2,900 |
$3,100 |
+6.9% |
|
Dual Occupancy |
$2,850 |
$3,050 |
+7.0% |
|
Rooming House |
$2,500 |
$2,650 |
+6.0% |
|
Terrace/Villas |
$3,000 |
$3,200 |
+6.7% |
|
Apartment |
$3,300 |
$3,450 |
+4.5% |
Queensland
|
Property Type |
Dec 2023 Avg (AUD/m²) |
Dec 2024 Avg (AUD/m²) |
% Change |
|
Co-Living |
$2,700 |
$2,850 |
+5.6% |
|
Dual Occupancy |
$2,650 |
$2,800 |
+5.7% |
|
Rooming House |
$2,300 |
$2,450 |
+6.5% |
|
Terrace/Villas |
$2,750 |
$2,950 |
+7.3% |
|
Apartment |
$2,900 |
$3,100 |
+6.9% |
Victoria
|
Property Type |
Dec 2023 Avg (AUD/m²) |
Dec 2024 Avg (AUD/m²) |
% Change |
|
Co-Living |
$2,800 |
$2,950 |
+5.4% |
|
Dual Occupancy |
$2,750 |
$2,900 |
+5.5% |
|
Rooming House |
$2,350 |
$2,500 |
+6.4% |
|
Terrace/Villas |
$2,900 |
$3,100 |
+6.9% |
|
Apartment |
$3,200 |
$3,350 |
+4.7% |
Western Australia
|
Property Type |
Dec 2023 Avg (AUD/m²) |
Dec 2024 Avg (AUD/m²) |
% Change |
|
Co-Living |
$2,400 |
$2,600 |
+8.3% |
|
Dual Occupancy |
$2,350 |
$2,500 |
+6.4% |
|
Rooming House |
$2,200 |
$2,350 |
+6.8% |
|
Terrace/Villas |
$2,500 |
$2,700 |
+8.0% |
|
Apartment |
$2,700 |
$2,900 |
+7.4% |
Key Observations:
-
Co-Living properties in Western Australia saw the highest percentage growth (+8.3%) due to increased demand in regional areas.
-
New South Wales remains the most expensive state for construction, driven by urban developments.
-
Apartment costs rose moderately nationwide, indicating stable demand in metropolitan areas.
4. State-Specific Observations
Construction Costs by State
|
State |
Dec 2023 Avg (AUD/m²) |
Dec 2024 Avg (AUD/m²) |
% Change |
|
New South Wales |
$2,800 |
$3,000 |
+7.1% |
|
Queensland |
$2,600 |
$2,750 |
+5.8% |
|
Victoria |
$2,700 |
$2,900 |
+7.4% |
|
Western Australia |
$2,400 |
$2,550 |
+6.3% |
|
South Australia |
$2,500 |
$2,650 |
+6.0% |
|
Tasmania |
$2,350 |
$2,500 |
+6.4% |
|
Northern Territory |
$2,200 |
$2,400 |
+9.1% |
|
ACT |
$2,900 |
$3,100 |
+6.9% |
Key Observations:
-
New South Wales and Victoria saw the highest costs, driven by urban demand.
-
Northern Territory experienced the sharpest percentage increase, influenced by infrastructure development and regional investments.
5. Land Costs Analysis
Land Costs per Square Meter by State and Region
|
State |
Dec 2023 Avg (AUD/m²) |
Dec 2024 Avg (AUD/m²) |
% Change |
|
New South Wales |
$1,500 |
$1,650 |
+10.0% |
|
Queensland |
$1,200 |
$1,300 |
+8.3% |
|
Victoria |
$1,350 |
$1,450 |
+7.4% |
|
Western Australia |
$1,000 |
$1,100 |
+10.0% |
|
South Australia |
$1,050 |
$1,150 |
+9.5% |
|
Tasmania |
$950 |
$1,050 |
+10.5% |
|
Northern Territory |
$800 |
$900 |
+12.5% |
|
ACT |
$1,700 |
$1,850 |
+8.8% |
Key Observations:
-
Tasmania and Northern Territory led the percentage increase in land costs.
-
Urban areas in New South Wales and ACT remain the most expensive for land acquisition.
6. Insights and Implications
-
Inflationary Pressures: Rising costs are largely due to inflation, increased material prices, and labour shortages.
-
Regional Growth: Demand in regions like Northern Territory and Tasmania highlights emerging investment hotspots.
-
Specialised Housing: Growth in Co-Living and SDA housing reflects societal and market shifts toward affordability and inclusivity.
Implications for Investors
-
Urban markets remain high-cost but stable investments.
-
Emerging regional areas offer significant growth potential but require due diligence.
-
Specialized properties like SDA and Co-Living can yield higher returns due to demand.
7. Conclusion and Recommendations
Summary
The data reflects a general increase in both construction and land costs across Australia, driven by economic and market factors. While traditional investments remain stable, niche property types and emerging regions present lucrative opportunities.
Recommendations
-
Monitor Regional Markets: Consider investing in regions like the Northern Territory and Tasmania.
-
Focus on Niche Properties: Co-Living and Rooming Houses are positioned for high demand.
-
Conduct Due Diligence: Each region and suburb has its nuances make sure you conduct extensive due diligence for all properties you are considering investing in.
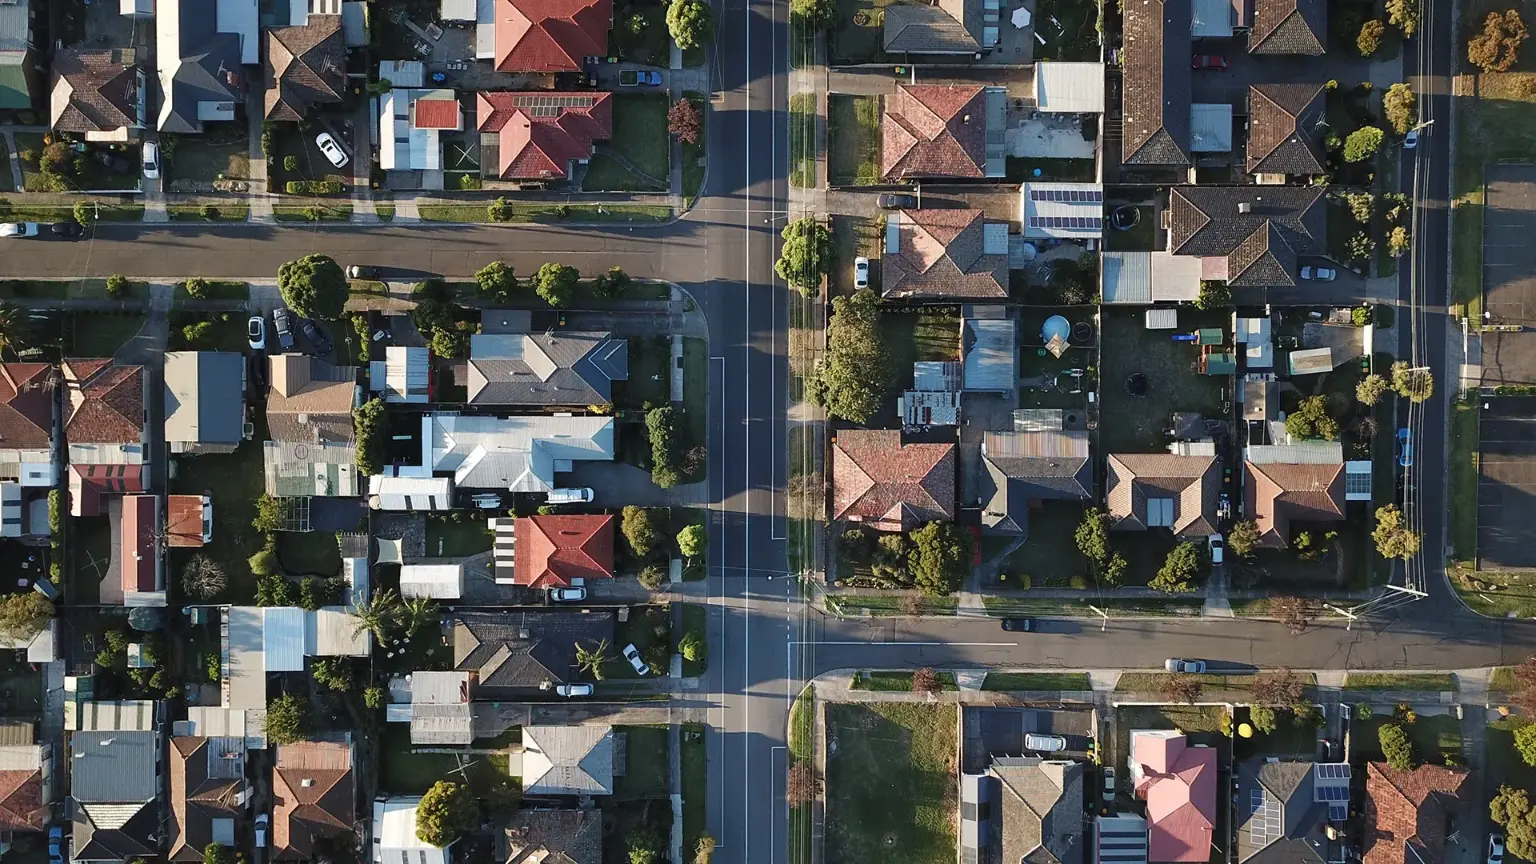
Source: Aus Investment Properties (www.ausinvestmentproperties.com.au) Photo by Troy Mortier on Unsplash
Disclaimer: This report is based on data available from December 2023 and December 2024. While efforts have been made to ensure accuracy, investors are advised to conduct their own research and consult professionals before making investment decisions.
_1736206952XpKBO-cover.jpg)

_17701746679NQAl.jpg)
_176766512377GnS.png)
_1764731815HUFUX.jpg)
_1764211036lHsm6.png)
_1762916285NoFl4.jpg)


