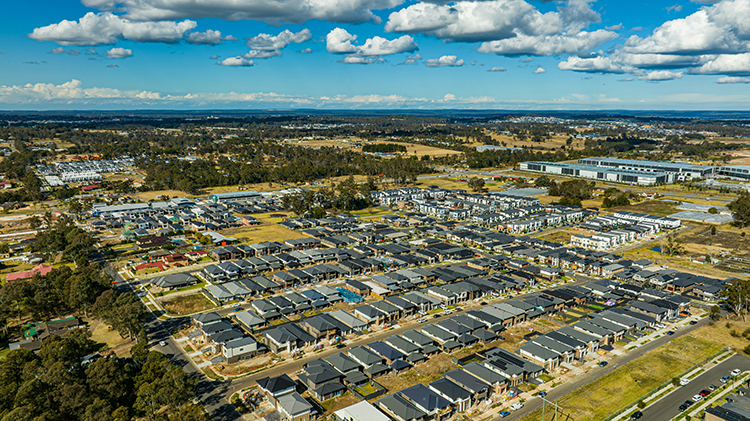
While some markets tighten and others show renewed activity, smart investors are positioning themselves ahead of the spring surge.
Australia’s Mid-Year Property Snapshot
In July 2025, total residential property listings fell 3% month-on-month and 1.8% year-on-year, according to SQM Research. This measured retreat in vendor activity shows many sellers are holding off ahead of the busy spring selling season.
For Australian property investors, this market phase presents a unique set of opportunities. Supply is tightening in some cities, while others are seeing renewed confidence — and knowing where to focus could be the key to your next successful investment.
Capital City Performance: Where to Look
Sydney & Adelaide: Gradual Growth
Both cities recorded annual listing increases — Sydney up 4.5% and Adelaide up 6.5% — though both saw minor monthly drops.
Perth: Demand Still Strong
Perth had the largest annual rise in listings at 17%, despite a 9.3% monthly decline. This suggests strong underlying demand and possible short-term buying windows before prices climb.
Melbourne & Brisbane: Supply Contraction
Melbourne dropped 3.3% in July and 4.2% annually. Brisbane saw a 1.6% monthly and 7.8% yearly fall — making it a potential hotspot for price growth if demand holds steady.
Darwin: Supply Squeeze
Darwin’s listings fell 36.7% year-on-year, leaving total listings below 1,000. Tight supply could create upward pressure on prices.
New Listings: A Cautious Seller Market
New listings nationally stayed flat at 62,798 in July but fell 4.7% year-on-year.
-
Sydney & Melbourne: Small monthly increases (0.5% and 0.4%)
-
Brisbane & Perth: Declines of 1.8% and 8.4% respectively
-
Darwin: Standout with a 27.7% monthly and 16.1% annual rise
-
Brisbane: Largest annual drop at 14.6%, limiting fresh opportunities
Investor tip: Keep an eye on Darwin for increased choice, while Brisbane’s reduced pipeline could drive competition.
Old Listings: Negotiation Potential
Listings over 180 days dropped 4.9% in July but remain 10.1% higher than last year.
-
Sydney: Up 28.3% year-on-year
-
Canberra: Up 55.8% year-on-year
-
Adelaide: Only capital to see a monthly rise (+1.3%)
Investor tip: Older listings can present negotiation opportunities, especially in markets with high long-standing stock.
Distressed Listings: Market Stability Improves
Distressed listings fell 5.5% in July and 15.4% year-on-year.
-
Queensland & WA: Strongest declines (-23.3% and -30.3%)
-
South Australia: Annual rise of 13.2% shows isolated pressure points
-
Northern Territory: Only state with a monthly increase (+4.1%)
Fewer distressed sales means greater market stability, but investors chasing distressed bargains may have fewer options.
Asking Prices: Balanced Growth in Houses & Units
In early August, national dwelling prices rose 0.3% week-on-week to $918,674.
-
Houses: Up 0.1% to $1,008,727
-
Units: Up 1.4% to $592,803 — outpacing houses
-
3-Bed Houses: Slight 0.1% dip but long-term growth remains strong
Investor tip: Units are showing competitive growth and could deliver better yields in affordability-driven markets.
5 Key Takeaways for Investors
-
Watch for market tightening — Brisbane’s falling supply could fuel price increases.
-
Negotiate on older listings — Elevated aged stock means potential vendor flexibility.
-
Consider units — They’re gaining price momentum while remaining more affordable.
-
Get ready for spring — A surge in listings could be just around the corner.
-
Focus on growth markets — Perth and Darwin show strong activity and confidence.
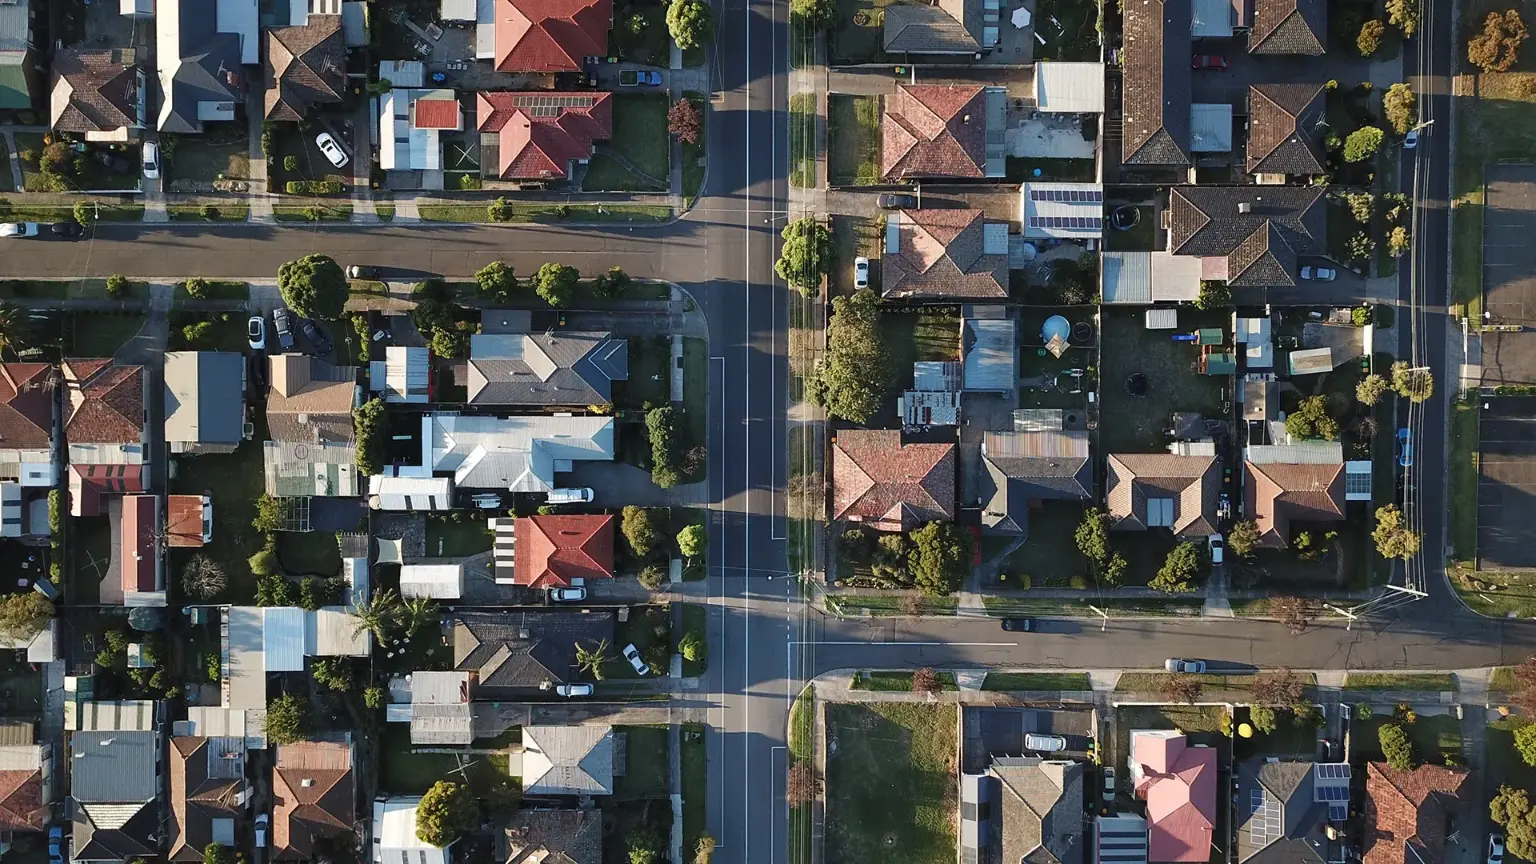
July 2025’s property trends show a market in transition. Some capitals are experiencing strong listing growth, others are tightening, and national distressed stock is falling — all pointing to a stable yet competitive environment.
For Australian property investors, now is the time to refine your strategy, target growth locations, and act before the spring market adds more competition.
Visit Aus Investment Properties to view all our available investment properties and secure your next high-performing asset today.
Source: SQM Research

_1776213150EC5td-card.jpg)
-(1)_17762144417K00n-card.png)
_1776298437p3Tbd-card.png)
_1776296186JxdiO-card.png)
_1776298926ZIsg0-card.png)
_1776299990GmS4J-card.png)

_1776213150EC5td.jpg)
-(1)_17762144417K00n.png)
_1776214724iUydB.png)