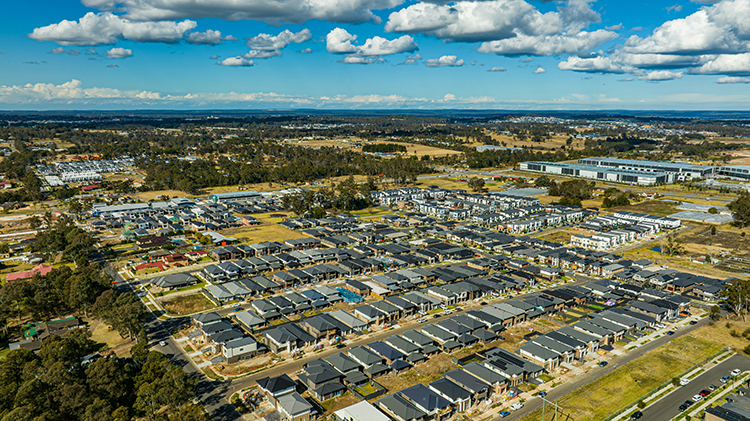
A shrinking pool of listings is reshaping opportunities for Australian investors heading into 2026
Australian investors are heading into the end of 2025 with a property market that is still tight on supply but showing strong buyer activity across capital cities. New SQM Research data from November 2025 reveals a sharp contraction in national listings, continued reduction in stale stock and yet another rise in asking prices. For property investors, these conditions are creating both challenges and strategic opportunities.
Below, we break down the latest figures and what they mean for anyone looking to secure high performing investment property in today’s climate.
National Listings Drop as Spring Winds Down
Total national listings fell 5.4 percent in November to 238,824 dwellings, according to SQM Research’s latest data from National Property Listings Fall Sharply in November
This leaves available stock sitting 12.4 percent below the same time last year.
Major capitals all recorded a decline. Sydney’s listings dropped 8.6 percent, Brisbane fell 9.2 percent and Melbourne was down 4.7 percent. Even Perth and Adelaide, which have been running some of the strongest markets nationwide, saw reductions of 6.2 percent and 3.2 percent.
One of the more striking shifts is Brisbane’s annual decline. Listings there sit 22.4 percent below last year. With buyers continuing to absorb what limited stock does come to market, this shortage has been a key driver behind Brisbane’s accelerating price growth.
Darwin remains the weakest performer on an annual basis, down 37.3 percent year on year. Hobart followed with a 14.2 percent decline.
Investors wanting choice need to act fast when quality stock appears, as competition remains intense in several markets.
New Stock Slows Sharply After Spring
November typically marks the end of the spring selling period, and this year’s seasonal slowdown was notable. New listings dropped 11.3 percent nationally, with Sydney recording a significant 19.2 percent fall.
While seasonal patterns explain part of this drop, the total number of new listings remains 5 percent lower than November 2024. This suggests that fewer homeowners are choosing to sell, even as prices rise.
For investors, this means less fresh stock entering the market and greater pressure on existing listings. Markets like Hobart, which was up 3.6 percent, were rare exceptions to the national trend.
Older Listings Continue to Clear Out
One of the clearest indicators of strong buyer demand is the continued reduction in older listings. Properties on the market for 180 days or more fell 7.9 percent nationally in November, and are now 10.1 percent lower than a year ago.
Perth saw one of the steepest monthly declines at 20.9 percent. Brisbane, Adelaide and Canberra also recorded firm drops in older stock.
This ongoing clearance of properties that once lingered highlights that buyers are far more willing to take up options previously considered overpriced or less desirable. Investors reading the market closely may find fewer bargains, but the underlying demand adds confidence to long term capital growth prospects.
Distressed Listings Keep Falling
An important snapshot of financial conditions comes from distressed listings. Nationally, distressed stock fell another 2.2 percent in November and is 32.3 percent lower than a year ago.
Western Australia and Queensland led the monthly declines, down 5.4 percent and 11 percent respectively. Even with the higher interest rate environment, most homeowners appear to be managing repayments effectively. This keeps forced sales low and helps maintain upward pressure on prices.
For investors seeking distressed opportunities, the pool is now significantly reduced. These conditions typically point toward continued market resilience.
Asking Prices Continue Their Upward Climb
Despite tightening supply and seasonal slowdown, asking prices continued to rise across most capitals. National house asking prices gained 1 percent for the month, while units rose 1.6 percent.
Brisbane, Perth and Adelaide remain standout performers.
Brisbane:
House prices up 3.4 percent monthly and 15.7 percent annually.
Unit prices up 21.5 percent over the year.
Perth:
House prices up 0.8 percent monthly and 9.2 percent annually.
Units surging 19.5 percent annually.
Adelaide:
Houses up 3.4 percent monthly and 15.6 percent annually.
Units up an astonishing 21.9 percent annually.
Sydney, Melbourne and Canberra saw slower growth, but still recorded positive or stable performance in most categories.
These gains are consistent with a classic supply driven market. When listings fall and buyer activity stays strong, prices tend to climb.
What This Means for Australian Property Investors
The current market presents a mix of strong fundamentals and competitive conditions. The shortage of stock, especially in high demand regions, continues to drive price growth. Investors waiting for a significant correction may find themselves left behind as long as supply remains limited.
Three major themes stand out:
1. Tight supply is now a national trend
With listings sitting well below 2024 levels, pressure is likely to remain through early 2026 unless there is a strong uptick in new stock.
2. High demand markets are accelerating
Brisbane, Perth and Adelaide continue to lead the country in both price growth and listing absorption.
3. Distressed opportunities are shrinking
The sharp decline in distressed listings signals financial stability and limits discount buying.
For investors, this means the window for well priced opportunities is narrower. Smart decisions come from understanding where demand is likely to remain highest and selecting areas that offer both rental yield and capital growth potential.
November’s steep drop in listings confirms that Australia is still in the grip of a supply constrained market. Buyer demand remains strong across most capitals, older stock continues to clear and prices are rising in key investment cities. For Australian property investors, this environment requires a proactive and research driven approach.
Whether you are entering the market or expanding your portfolio, the best opportunities will go quickly. Having access to quality property options and current data is more important than ever.
Visit our website to view all our available investment properties www.ausinvestmentproperties.com.au
Source File: SQM Research | Photo: Hc Digital
_1776296186JxdiO-cover.png)
_1776213150EC5td-card.jpg)
-(1)_17762144417K00n-card.png)
_1776214724iUydB-card.png)
_1776298926ZIsg0-card.png)
_1776299990GmS4J-card.png)


_1776213150EC5td.jpg)
-(1)_17762144417K00n.png)
_1776214724iUydB.png)