The December 2025 Quarterly Property Report provides an overview of current pricing trends across new-build and packaged residential property offerings in Australia. Drawing on current market listings analysed by Aus Investment Properties, this report follows the same structure and methodology used in previous quarterly reports, with expanded analysis to support clear, data-backed comparisons across time periods, property types and locations.
Overview
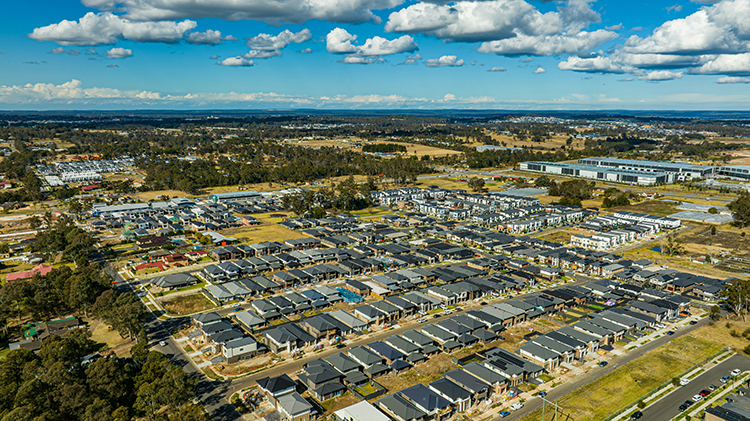
The Australian residential investment market closed 2025 with continued price resilience across new-build and packaged property offerings. Based on listings tracked by Aus Investment Properties in December 2025, pricing movements remain primarily driven by land values rather than construction costs.
Compared with October 2025, land prices per square metre increased across most property categories and states. Build prices per square metre remain elevated relative to December 2024 but showed signs of moderation on a quarter-on-quarter basis in several categories. This reflects a more stable construction cost environment compared with earlier periods of rapid escalation.
Differences between property categories and regions remain pronounced. Movements between reporting periods reflect not only broader market conditions, but also changes in dwelling size, land characteristics and product mix within current market listings analysed by Aus Investment Properties.
Key national statistics
Average build price per square metre (national)
|
Period
|
Build $/m²
|
|
December 2024
|
$2,313
|
|
October 2025
|
$2,394
|
|
December 2025
|
$2,493
|
This represents:
Average land price per square metre (national)
|
Period
|
Land $/m²
|
|
December 2024
|
$993
|
|
October 2025
|
$980
|
|
December 2025
|
$1,030
|
This represents an increase of approximately 5.1 per cent quarter-on-quarter, reflecting a rebound from lower land pricing recorded in October 2025, and an increase of approximately 3.7 per cent year-on-year compared with December 2024.
Build price per square metre by property category
|
Property Type
|
Dec 2024
|
Oct 2025
|
Dec 2025
|
QoQ Change
|
YoY Change
|
|
Co-living
|
$2,324
|
$2,265
|
$2,242
|
-1.0%
|
-3.5%
|
|
Dual Key
|
$2,534
|
$2,674
|
$2,600
|
-2.8%
|
+2.6%
|
|
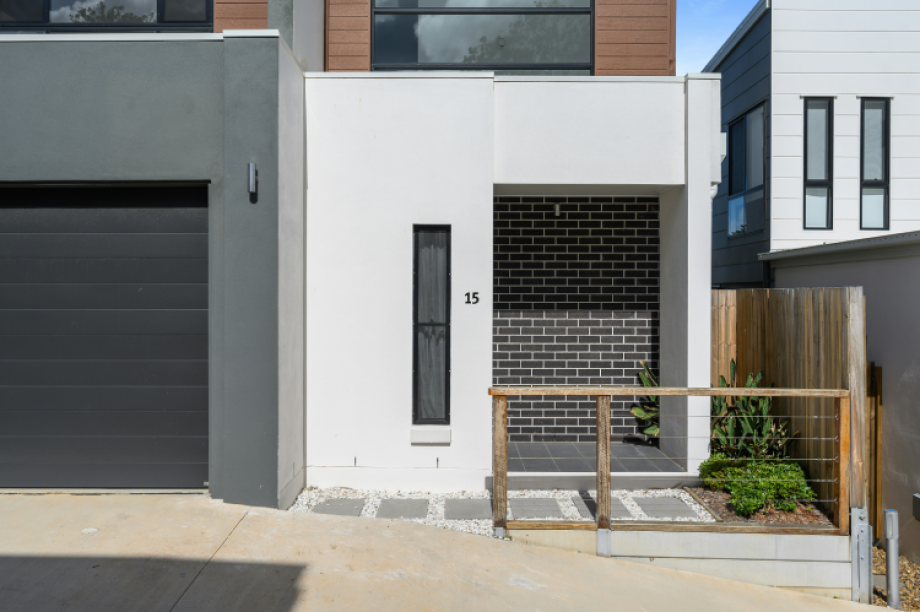
Dual Occupancy
|
$2,757
|
$3,108
|
$2,896
|
-6.8%
|
+5.1%
|
|
Duplex
|
$2,505
|
$2,715
|
$2,856
|
+5.2%
|
+14.0%
|
|
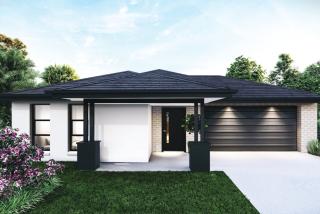
House and Land
|
$2,238
|
$2,283
|
$2,339
|
+2.4%
|
+4.5%
|
|
Rooming House
|
$2,883
|
$2,905
|
$3,064
|
+5.4%
|
+6.3%
|
Build pricing remains elevated compared with December 2024. Quarter-on-quarter moderation in some categories reflects changes in dwelling mix rather than a broad reduction in construction input costs.
Land price per square metre by property category
|
Property Type
|
Dec 2024
|
Oct 2025
|
Dec 2025
|
QoQ Change
|
YoY Change
|
|
Co-living
|
$970
|
$869
|
$906
|
+4.3%
|
-6.6%
|
|
Dual Key
|
$769
|
$746
|
$935
|
+25.3%
|
+21.5%
|
|
Dual Occupancy
|
$790
|
$584
|
$811
|
+38.7%
|
+2.6%
|
|
Duplex
|
$799
|
$815
|
$932
|
+14.4%
|
+16.7%
|
|
House and Land
|
$1,002
|
$1,072
|
$1,137
|
+6.1%
|
+13.5%
|
|
Rooming House
|
$1,531
|
$1,210
|
$1,447
|
+19.5%
|
-5.5%
|
Larger quarter-on-quarter movements in some categories reflect a lower pricing base in October 2025 and shifts in land mix, rather than abrupt changes in underlying land values.
Average package price by property category (House + Land)
|
Property Type
|
Dec 2024
|
Oct 2025
|
Dec 2025
|
QoQ Change
|
YoY Change
|
|
Co-living
|
$1,026,000
|
$1,041,000
|
$1,068,000
|
+2.6%
|
+4.1%
|
|
Dual Key
|
$884,000
|
$912,000
|
$957,000
|
+4.9%
|
+8.3%
|
|
Dual Occupancy
|
$1,089,000
|
$1,134,000
|
$1,178,000
|
+3.9%
|
+8.2%
|
|
Duplex
|
$1,241,000
|
$1,286,000
|
$1,332,000
|
+3.6%
|
+7.3%
|
|
House and Land
|
$676,000
|
$702,000
|
$728,000
|
+3.7%
|
+7.7%
|
|
Rooming House
|
$1,354,000
|
$1,402,000
|
$1,463,000
|
+4.3%
|
+8.1%
|
Average build price per square metre by region
Build prices per square metre vary materially by region due to differences in labour availability, dwelling specification and scale of development identified from current market listings analysed by Aus Investment Properties.
-
New South Wales: Highest average build pricing nationally
-
Queensland: Elevated build pricing, particularly in south-east Queensland
-
Victoria: Lowest average build pricing across major states
-
Western Australia: Build pricing remains elevated relative to historical norms
State-by-state pricing breakdown
This section provides a state-level comparison of build price per square metre, land price per square metre and average package price (House + Land), based on current market listings analysed by Aus Investment Properties.
Build price per square metre by state
|
State
|
Dec 2024
|
Oct 2025
|
Dec 2025
|
QoQ Change
|
YoY Change
|
|
New South Wales
|
$2,512
|
$2,618
|
$2,702
|
+3.2%
|
+7.6%
|
|
Queensland
|
$2,384
|
$2,446
|
$2,531
|
+3.5%
|
+6.2%
|
|
Victoria
|
$2,189
|
$2,231
|
$2,268
|
+1.7%
|
+3.6%
|
|
Western Australia
|
$2,327
|
$2,451
|
$2,498
|
+1.9%
|
+7.3%
|
Land price per square metre by state
|
State
|
Dec 2024
|
Oct 2025
|
Dec 2025
|
QoQ Change
|
YoY Change
|
|
New South Wales
|
$1,284
|
$1,322
|
$1,389
|
+5.1%
|
+8.2%
|
|
Queensland
|
$892
|
$921
|
$978
|
+6.2%
|
+9.6%
|
|
Victoria
|
$836
|
$871
|
$902
|
+3.6%
|
+7.9%
|
|
Western Australia
|
$641
|
$664
|
$689
|
+3.8%
|
+7.5%
|
Average package price by state (House + Land)
|
State
|
Dec 2024
|
Oct 2025
|
Dec 2025
|
QoQ Change
|
YoY Change
|
|
New South Wales
|
$942,000
|
$978,000
|
$1,018,000
|
+4.1%
|
+8.1%
|
|
Queensland
|
$698,000
|
$724,000
|
$758,000
|
+4.7%
|
+8.6%
|
|
Victoria
|
$652,000
|
$681,000
|
$706,000
|
+3.7%
|
+8.3%
|
|
Western Australia
|
$619,000
|
$642,000
|
$667,000
|
+3.9%
|
+7.8%
|
SDA pricing overview
Specialist Disability Accommodation properties differ materially from standard residential product in both design and cost structure. As a result, SDA pricing is reported separately to avoid distorting broader residential averages.
Based on current market listings analysed by Aus Investment Properties, SDA properties continue to exhibit higher build costs per square metre and higher total package prices than standard residential dwellings.
SDA pricing snapshot (December 2025)
|
Metric
|
December 2025
|
|
Average build price per m²
|
Higher than standard residential
|
|
Average land price per m²
|
Varies significantly by location
|
|
Typical package price range
|
$1.3m – $2.0m+
|
|
Key cost drivers
|
Design standards, compliance, bespoke construction
|
Data note:
SDA listings are not included in quarter-on-quarter or year-on-year comparison tables due to limited historical comparability and significant variation in dwelling specification. SDA pricing should be assessed on a case-by-case basis.
Investor outlook
Based on pricing trends identified from current market listings analysed by Aus Investment Properties, the near-term outlook for residential investment remains stable.
Land pricing is expected to remain the primary source of upward pressure on total package prices. Build cost growth appears more contained than in prior years, although higher-specification products such as Duplex, Rooming House and SDA continue to attract higher construction costs.
Short-term movements between quarters should be read in the context of product and land mix, as quarter-on-quarter changes can appear larger when measured from a temporarily lower base. Investors should continue to assess location, land efficiency and build quality rather than relying solely on headline package pricing.
Overall, pricing movements are expected to remain gradual, with land values likely to drive most changes in the near term.
Aus Investment Properties offers Australia's largest selection of off-market investment properties. Please visit www.ausinvestmentproperties.com.au to search, research and secure your perfect investment property.
Source: Aus Investment Properties www.ausinvestmentproperties.com | Photo: Filmreal Studio
Disclaimer: This report is based on data analysed by Aus Investment Properties as at December 2025, October 2025 and December 2024. The analysis reflects pricing identified from current market listings at each point in time and does not represent a valuation or forecast for any individual property. Investors should undertake their own due diligence and seek independent professional advice before making investment decisions.
-(1)_17762144417K00n-card.png)
_1776214724iUydB-card.png)
_1776296186JxdiO-card.png)
_1776298926ZIsg0-card.png)
_1776299990GmS4J-card.png)
_1776296853JHnDe-card.png)

_1776213150EC5td.jpg)
-(1)_17762144417K00n.png)
_1776214724iUydB.png)