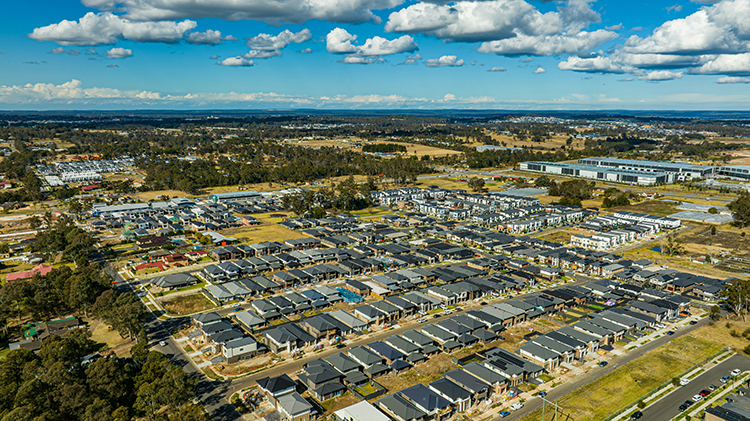
March 2026 Quarterly Property Report
Aus Investment Properties
Data analysed by Aus Investment Properties as at March 2026, with quarter-on-quarter comparison to December 2025 and year-on-year comparison to March 2025.
Introduction
This report provides a quarterly review of pricing across current market listings analysed by Aus Investment Properties. It is designed as an investor-grade market snapshot of build pricing, land pricing and package pricing across residential investment product types and key states.
Unless otherwise stated, all standard residential analysis excludes Specialist Disability Accommodation (SDA), which is reported separately because specification, compliance settings and package structure differ materially from non-SDA stock.
Overview
Based on listings tracked by Aus Investment Properties, average category-level build pricing reached $2,721 per square metre in March 2026. That was +2.1% quarter-on-quarter and +7.5% relative to March 2025.
Average land pricing eased to $996 per square metre on the same category-average basis, down -3.1% from December 2025 and -4.0% year-on-year. Average package pricing was $1,049,956, which was -6.3% quarter-on-quarter but +1.4% above March 2025.
Base effects are important in this quarter. Several segments were measured against a higher December 2025 package and land base, so the March 2026 pullback in some averages should not be read as a broad fall in underlying replacement costs. Equally, where March 2026 growth appears strong, part of the movement reflects comparison with a lower prior-period base or a change in product mix rather than a like-for-like repricing of identical dwellings.
Key National Statistics
Table: National Statistics
Metric | Mar 2025 | Dec 2025 | Mar 2026 | QoQ Change | YoY Change |
Average build price per square metre | $2,532 | $2,666 | $2,721 | +2.1% | +7.5% |
Average land price per square metre | $1,038 | $1,028 | $996 | -3.1% | -4.0% |
Average package price | $1,035,692 | $1,121,000 | $1,049,956 | -6.3% | +1.4% |
Build Price per Square Metre by Property Category
Duplex recorded the highest March 2026 build pricing at $3,257 per square metre, while Co-living recorded the lowest at $2,320 per square metre. Dual Occupancy and Rooming House both softened quarter-on-quarter, highlighting the role of base effects and dwelling mix.
Table: Build $ per m2 by Category
Property Type | Mar 2025 | Dec 2025 | Mar 2026 | QoQ Change | YoY Change |
Co-living | $2,269 | $2,242 | $2,320 | +3.5% | +2.2% |
Dual Key | $2,461 | $2,600 | $2,654 | +2.1% | +7.8% |
Dual Occupancy | $2,680 | $2,896 | $2,787 | -3.8% | +4.0% |
Duplex | $2,588 | $2,856 | $3,257 | +14.0% | +25.9% |
House and Land | $2,266 | $2,339 | $2,429 | +3.8% | +7.2% |
Rooming House | $2,927 | $3,064 | $2,881 | -6.0% | -1.6% |
Land Price per Square Metre by Property Category
Land outcomes were mixed. Dual Occupancy rose sharply from December 2025, while Co-living, Duplex and Rooming House moved lower. These changes are more consistent with shifts in lot size and location mix across current market listings analysed by Aus Investment Properties than with a single national land trend.
Table: Land $ per m2 by Category
Property Type | Mar 2025 | Dec 2025 | Mar 2026 | QoQ Change | YoY Change |
Co-living | $966 | $906 | $857 | -5.4% | -11.3% |
Dual Key | $959 | $935 | $940 | +0.5% | -2.0% |
Dual Occupancy | $756 | $811 | $920 | +13.4% | +21.7% |
Duplex | $782 | $932 | $815 | -12.6% | +4.2% |
House and Land | $1,176 | $1,137 | $1,158 | +1.8% | -1.5% |
Rooming House | $1,590 | $1,447 | $1,285 | -11.2% | -19.2% |
Average Package Price by Property Category
Package pricing remained highest in Duplex and Rooming House, but both categories also show the strongest sensitivity to compositional shifts. Co-living package pricing fell well below the December 2025 average even though build pricing increased, which indicates a lower land and package base in the March 2026 listing mix.
Table: Package Price by Category
Property Type | Mar 2025 | Dec 2025 | Mar 2026 | QoQ Change | YoY Change |
Co-living | $783,192 | $1,068,000 | $800,403 | -25.1% | +2.2% |
Dual Key | $1,052,641 | $957,000 | $991,897 | +3.6% | -5.8% |
Dual Occupancy | $960,142 | $1,178,000 | $1,077,324 | -8.5% | +12.2% |
Duplex | $1,253,596 | $1,332,000 | $1,413,526 | +6.1% | +12.8% |
House and Land | $798,657 | $728,000 | $835,783 | +14.8% | +4.6% |
Rooming House | $1,365,927 | $1,463,000 | $1,180,802 | -19.3% | -13.6% |
Average Build Price per Square Metre by Region
On the March 2026 listing set, Tasmania recorded the highest average build pricing at $3,561 per square metre, although that result is based on a smaller listing count than the larger eastern-state samples. Victoria recorded the lowest at $2,248 per square metre and remained the largest current-quarter sample.
Table: Build $ per m2 by Region
Region | Mar 2026 Build $/m² | Listings Analysed |
Tasmania | $3,561 | 21 |
Western Australia | $2,999 | 39 |
New South Wales | $2,989 | 259 |
Queensland | $2,792 | 163 |
South Australia | $2,746 | 59 |
Northern Territory | $2,742 | 4 |
Victoria | $2,248 | 844 |
State-by-State Pricing Breakdown
State comparison is limited to the four states available in the supplied December 2025 comparison tables. March 2026 results show particularly strong build and package pricing in Western Australia and New South Wales, while Victoria remained the lowest-cost state across all three pricing measures.
Build Price per Square Metre by State
Table: Build $ per m2 by State
State | Mar 2025 | Dec 2025 | Mar 2026 | QoQ Change | YoY Change |
New South Wales | $2,565 | $2,702 | $2,989 | +10.6% | +16.5% |
Queensland | $2,239 | $2,531 | $2,792 | +10.3% | +24.7% |
Victoria | $2,272 | $2,268 | $2,248 | -0.9% | -1.1% |
Western Australia | $2,454 | $2,498 | $2,999 | +20.1% | +22.2% |
Land Price per Square Metre by State
Table: Land $ per m2 by State
State | Mar 2025 | Dec 2025 | Mar 2026 | QoQ Change | YoY Change |
New South Wales | $1,167 | $1,389 | $1,276 | -8.1% | +9.3% |
Queensland | $1,273 | $978 | $1,024 | +4.7% | -19.6% |
Victoria | $999 | $902 | $984 | +9.1% | -1.5% |
Western Australia | $886 | $689 | $1,211 | +75.8% | +36.7% |
Average Package Price by State
Table: Package Price by State
State | Mar 2025 | Dec 2025 | Mar 2026 | QoQ Change | YoY Change |
New South Wales | $1,021,346 | $1,018,000 | $1,199,690 | +17.8% | +17.5% |
Queensland | $907,236 | $758,000 | $1,157,791 | +52.7% | +27.6% |
Victoria | $715,670 | $706,000 | $763,648 | +8.2% | +6.7% |
Western Australia | $786,031 | $667,000 | $1,064,318 | +59.6% | +35.4% |
SDA Pricing Overview
SDA is reported separately because it can materially distort broader residential averages. Based on listings tracked by Aus Investment Properties, the March 2026 SDA subset was concentrated in Victoria, with smaller representation in Western Australia and the Northern Territory.
Average March 2026 SDA build pricing was $4,193 per square metre, materially above standard residential category averages. The March 2026 average SDA package price was $1,240,725, with an observed package range of $908,000 to $1,764,320.
Base effects are particularly important in SDA because each quarter can contain a small number of highly specialised dwellings. That means period-to-period movement can reflect design mix as much as market repricing.
Table: SDA Pricing Overview
Metric | Mar 2025 | Mar 2026 |
Listings analysed | 52 | 12 |
Average build price per square metre | $2,981 | $4,193 |
Average land price per square metre | $749 | $1,034 |
Average package price | $911,058 | $1,240,725 |
Package price range | $797,035 to $1,142,580 | $908,000 to $1,764,320 |
Investor Outlook
The March 2026 data points to a market where construction pricing remains firm, but not uniformly higher across every segment. Land pricing is less directional than it appeared in December 2025, and package pricing continues to be influenced heavily by lot size, location and product composition.
For investors, the most important read-through is that headline package moves should be tested against the underlying build and land components. Where package prices have fallen against December 2025, the move often appears linked to a lower comparison base or a different stock mix rather than a broad decline in build cost fundamentals.
Near-term pricing risk remains more concentrated in land and in higher-specification product types such as Duplex, Rooming House and SDA. Investors should continue to assess location quality, land efficiency, dwelling specification and end-demand fundamentals before relying on aggregate averages.
Aus Investment Properties offers Australia's largest selection of off-market investment properties. Please visit www.ausinvestmentproperties.com.au to search, research and secure your perfect investment property.
Source: Aus Investment Properties www.ausinvestmentproperties.com
Photo: Shanjir H
Disclaimer: This report is based on data analysed by Aus Investment Properties as at March 2026, December 2025 and March 2025. The analysis reflects pricing identified from current market listings at each point in time and does not represent a valuation, forecast or recommendation for any individual property. While reasonable care has been taken in preparing this report, readers should undertake their own due diligence and obtain independent professional advice before making investment decisions.
_1776213150EC5td-cover.jpg)
-(1)_17762144417K00n-card.png)
_1776298437p3Tbd-card.png)
_1776296186JxdiO-card.png)
_1776298926ZIsg0-card.png)
_1776299990GmS4J-card.png)
_1776296853JHnDe-card.png)
_1776213150EC5td.jpg)
-(1)_17762144417K00n.png)
_1776214724iUydB.png)