
New vs Established Investment Property in 2026: Why the Tax Rules Now Favour New Builds
From 1 July 2027, two investors paying the same price for the same rent can face very different tax bills, simply because one dwelling is new.
 By Aus Investment Properties
- Investment Properties Investment , Real Estate , Investment Properties , Australia Real Estate , Aus Investment Properties , Negative Gearing , Capital Gains Tax , New Builds

Bridging the Gap: How Australia's Housing Shortage Presents a Golden Opportunity for Property Investors
Don't just observe the housing crisis – leverage it. Understand how Australia's unprecedented dwelling deficit could be the catalyst for your next successful investment. Australia is grappling with a significant housing shortage, a topic dominating headlines and impacting individuals across the nation. While the human element of this crisis is undeniable, for astute property investors, it also presents a compelling, long-term opportunity.
- By Aus Investment Properties
- Investment Properties Real Estate , Investment Properties , Real Estate Australia , Aus Investment Properties , Australian Property Investment

August 2025 Property Listings Surge: Opportunities for Australian Property Investors
National housing supply rises as Sydney and Melbourne lead the surge, creating new options for investors across Australia August 2025 delivered a noticeable shift in Australia’s property market, with national listings climbing 5.2% month on month. While this signals renewed confidence among vendors, overall supply remains 4.2% lower than the same time last year. For investors, this mix of rising monthly supply and subdued annual volumes highlights a property sector in transition. The market is no longer at its tightest point, but it is also a long way from the runaway growth cycles of earlier years. Instead, investors face a more nuanced environment where new opportunities are emerging, yet careful due diligence and strategic selection remain essential.
- By Aus Investment Properties
- Investment Properties , Australia Real Estate , Real Estate Australia , Aus Investment Properties

National Property Listings Show Mixed Signals: What This Means for Investors in 2025
In July 2025, total residential property listings fell 3% month-on-month and 1.8% year-on-year, according to SQM Research. This measured retreat in vendor activity shows many sellers are holding off ahead of the busy spring selling season. For Australian property investors, this market phase presents a unique set of opportunities. Supply is tightening in some cities, while others are seeing renewed confidence — and knowing where to focus could be the key to your next successful investment.
- By Aus Investment Properties
- Investment , Investment Properties , Real Estate Australia , Aus Investment Properties
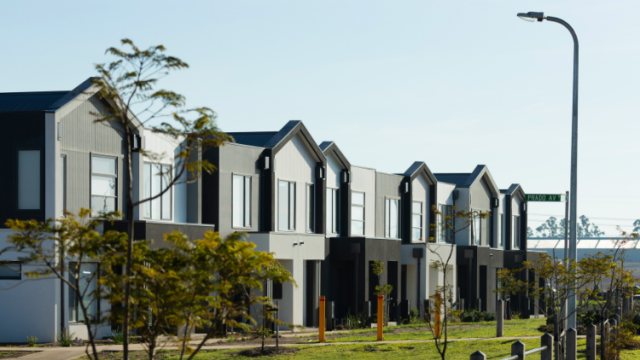
Australia’s Property Listings Slide Further – What This Means for Investors in 2025
As demand surges and stock tightens, investors are turning to high-yield strategies. Australia’s property market continues to tighten, with the latest June 2025 figures from SQM Research revealing an 8.8% monthly drop in total residential property listings. This shift reflects more than just a seasonal trend—it signals a growing imbalance between housing supply and demand across the country.
- By Aus Investment Properties
- Investment Properties , Real Estate , Australia Property Market Investment , Property , Investment Properties , Australia Real Estate

Aus Investment Properties Quarterly Report – July 2025
Australian Turn-Key Investment Property Building Costs Per Square Metre. Overview: As of July 2025, the national average build cost across all turnkey investment property types has continued to rise, reflecting ongoing supply chain pressures, increased labour costs, and strong investor demand. This report breaks down the average build price per square metre for key investment property types across Australia, compared with March 2025 data.
- By Aus Investment Properties
- Co-Living Properties , Investment Properties , SDA Properties , SMSF Investment Properties , Investment , Quarterly Report SDA Properties , Real Estate , Co-Living , Dual Occupancy , Duplex , Investment Properties , Australia Real Estate , Real Estate Australia , Investors , Quarterly Report
Why Buy With Aus Investment Properties?
- Dedicated In-house Project Manager.
- High-yielding properties.
- Independent rental assessment.
- Full turnkey properties, 'Ready to Rent'.
- Brand new properties with builders warranty.
- High quality, highly specified properties.
- Tax and depreciation benefits from new properties.
- Buy direct from the builder.
- Investor or SMSF.
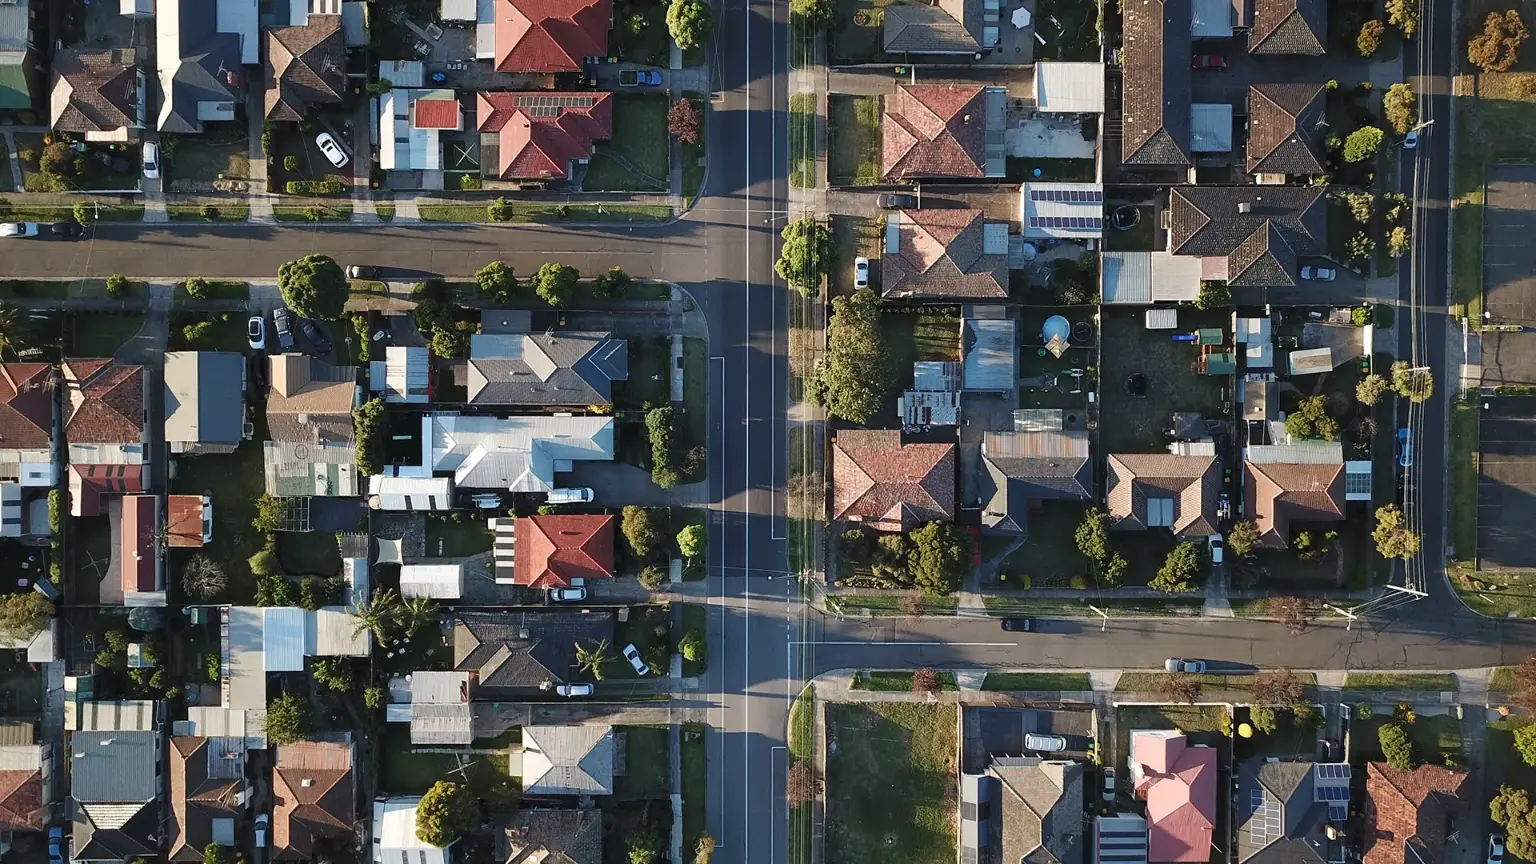
Capital Growth 12 months, measures the increase in a property’s value over the previous 12 months, indicating how much the investment has appreciated in that timeframe.
Capital Growth 10-year annualised, reflects the average annual increase in a property’s value over the last decade, smoothing out short-term fluctuations to show long-term appreciation trends.
Vacancy Rate, indicates the percentage of properties that are currently unoccupied in that postcode, It’s a key indicator for investors to assess the rental demand.