
New vs Established Investment Property in 2026: Why the Tax Rules Now Favour New Builds
From 1 July 2027, two investors paying the same price for the same rent can face very different tax bills, simply because one dwelling is new.
 By Aus Investment Properties
- Investment Properties Investment , Real Estate , Investment Properties , Australia Real Estate , Aus Investment Properties , Negative Gearing , Capital Gains Tax , New Builds
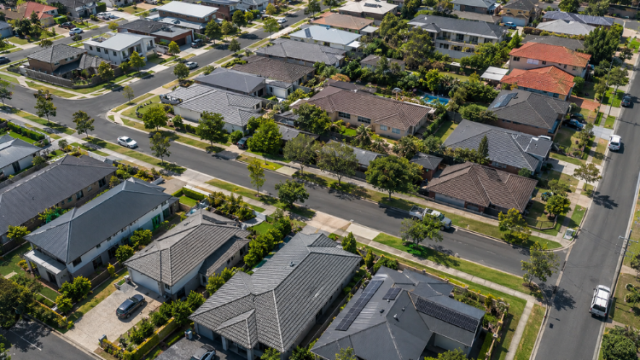
Are High Yield Properties the Future of Property Investing?
TL;DR The May 2026 Federal Budget abolished negative gearing for established properties purchased after 12 May 2026 and will replace the 50 per cent CGT discount with indexation from 1 July 2027. New builds are exempt and keep both tax benefits. With ABS data showing rents still rising and housing the biggest driver of inflation, high yield new builds such as co-living, dual occupancy and duplex homes now offer stronger cash flow and better tax treatment.
- By Aus Investment Properties
- Investment , Australia Real Estate , Real Estate Australia , Aus Investment Properties , High Yield Properties , Tax Reform 2026

March 2026 Quarterly Property Report
This report provides a quarterly review of pricing across current market listings analysed by Aus Investment Properties. It is designed as an investor-grade market snapshot of build pricing, land pricing and package pricing across residential investment product types and key states. Unless otherwise stated, all standard residential analysis excludes Specialist Disability Accommodation (SDA), which is reported separately because specification, compliance settings and package structure differ materially from non-SDA stock.
- By Aus Investment Properties
- Quarterly Report Australia Real Estate , Real Estate Australia , Aus Investment Properties

Australian Property Investment in 2026: What the Growth Forecasts Mean for Investors
Australian property market forecasts for 2026 are generally positive, with most analysts expecting moderate price growth across the country. For property investors, however, headline growth figures tell only part of the story. The real question is not whether prices will rise, but where investment property fundamentals still stack up under tighter borrowing conditions and higher holding costs.
- By Aus Investment Properties
- Investment , Australia Real Estate , Real Estate Australia , Australia's Property Market Forecast , Investment Property 2026

August 2025 Property Listings Surge: Opportunities for Australian Property Investors
National housing supply rises as Sydney and Melbourne lead the surge, creating new options for investors across Australia August 2025 delivered a noticeable shift in Australia’s property market, with national listings climbing 5.2% month on month. While this signals renewed confidence among vendors, overall supply remains 4.2% lower than the same time last year. For investors, this mix of rising monthly supply and subdued annual volumes highlights a property sector in transition. The market is no longer at its tightest point, but it is also a long way from the runaway growth cycles of earlier years. Instead, investors face a more nuanced environment where new opportunities are emerging, yet careful due diligence and strategic selection remain essential.
- By Aus Investment Properties
- Investment Properties , Australia Real Estate , Real Estate Australia , Aus Investment Properties
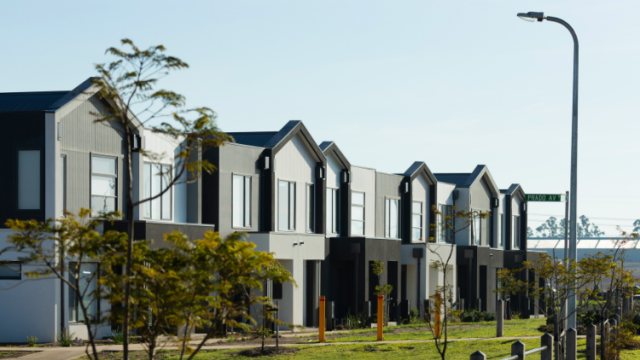
Australia’s Property Listings Slide Further – What This Means for Investors in 2025
As demand surges and stock tightens, investors are turning to high-yield strategies. Australia’s property market continues to tighten, with the latest June 2025 figures from SQM Research revealing an 8.8% monthly drop in total residential property listings. This shift reflects more than just a seasonal trend—it signals a growing imbalance between housing supply and demand across the country.
- By Aus Investment Properties
- Investment Properties , Real Estate , Australia Property Market Investment , Property , Investment Properties , Australia Real Estate
Why Buy With Aus Investment Properties?
- Dedicated In-house Project Manager.
- High-yielding properties.
- Independent rental assessment.
- Full turnkey properties, 'Ready to Rent'.
- Brand new properties with builders warranty.
- High quality, highly specified properties.
- Tax and depreciation benefits from new properties.
- Buy direct from the builder.
- Investor or SMSF.

Capital Growth 12 months, measures the increase in a property’s value over the previous 12 months, indicating how much the investment has appreciated in that timeframe.
Capital Growth 10-year annualised, reflects the average annual increase in a property’s value over the last decade, smoothing out short-term fluctuations to show long-term appreciation trends.
Vacancy Rate, indicates the percentage of properties that are currently unoccupied in that postcode, It’s a key indicator for investors to assess the rental demand.