Quarterly Property Market Trends

  • User By Aus Investment Properties


Australian Residential Property: Q2 2026


Postcode level capital growth, long term performance and vacancy analysis


Reporting Perion Q1-Q2 2026


Report Summary


Australia's postcode level residential markets delivered another strong year of capital growth to Q1 2026, but the strength was far from uniform. Across the 899 postcode markets that passed our market-depth guardrail (at least 30 settled sales in both quarters), the median house market recorded 12.9% capital growth over the year and the median unit market 11.2% capital growth. Western Australia, Queensland and the Northern Territory carried the momentum, while Sydney, Melbourne and Canberra grew at a much more modest pace. Rental markets remain tight: half of all eligible postcodes recorded a vacancy rate under 1%, although vacancy has eased slightly since the previous quarter. As always, a strong growth figure on its own should not be treated as a standalone buy signal: capital growth and rental demand should be assessed together.


  • Capital growth: the median eligible house market posted 12.9% one-year capital growth and the median unit market 11.2%; roughly one in ten eligible markets went backwards, so the national medians conceal genuine dispersion.
  • Vacancy: the median postcode vacancy rate is 1.00% (April to June 2026 average), up modestly from about 0.90% in the prior quarter, and 50% of eligible postcodes sit under 1%, which suggests rental-market pressure remains widespread.
  • Houses versus units: houses lead on capital growth nationally over both horizons (median 10-year annualised capital growth of 7.1% for houses versus 3.6% for units), but units out-grew houses over the past year in QLD and WA.
  • Recent momentum leaders: the strongest eligible one-year capital growth markets cluster in Perth's northern corridor (postcodes 6028 and 6027, both near 38% capital growth for houses) and regional WA units (Bunbury, postcode 6230, 39.2% capital growth), figures that warrant scepticism and require additional due diligence.
  • Long-term leaders: south east Queensland dominates the 10-year annualised capital growth tables, led by the Moreton Bay islands (postcode 4184, 19.5% annualised) and the Coomera to Pimpama corridor (postcode 4209, 15.0% annualised), both of which also posted strong recent capital growth and are worth further investigation.
  • Main takeaway: the markets that combine positive recent capital growth, a solid 10-year capital growth track record and tight vacancy are concentrated in Queensland and Western Australia; the balanced tables in Section 6 are the best screening starting point, not a shortlist of recommendations.

Introduction


This report is the quarterly postcode level review of Australian residential investment markets prepared by Aus Investment Properties. Its purpose is to give investors a disciplined, data-driven view of where capital growth and rental demand currently sit, and to do so with guardrails that strip out statistically thin or extreme results before they can mislead.


Three measures are used throughout. One-year capital growth (Q1 2025 to Q1 2026) captures recent momentum. Ten-year annualised capital growth (2015 to 2025) captures the long-term track record and smooths out single-cycle noise. The vacancy rate (the April to June 2026 monthly average for each postcode) is our indicator of rental demand: a low vacancy rate suggests rental-market pressure, while an elevated one points to softer tenant demand or new supply. No single measure is sufficient on its own; capital growth and rental demand should be assessed together.


All figures are postcode level. A postcode can span several suburbs with quite different characteristics, so nothing in this report should be read as suburb level analysis. Vacancy is also postcode level only and is not split by houses and units. Growth percentages throughout this report are capital growth figures, not rental yields.


National market snapshot


The four charts below summarise the eligible universe: the 899 postcode markets (728 postcodes; 627 house markets and 272 unit markets) that passed the 30-settled-sales depth guardrail in both quarters and were not removed by the 40% extreme-growth cap.
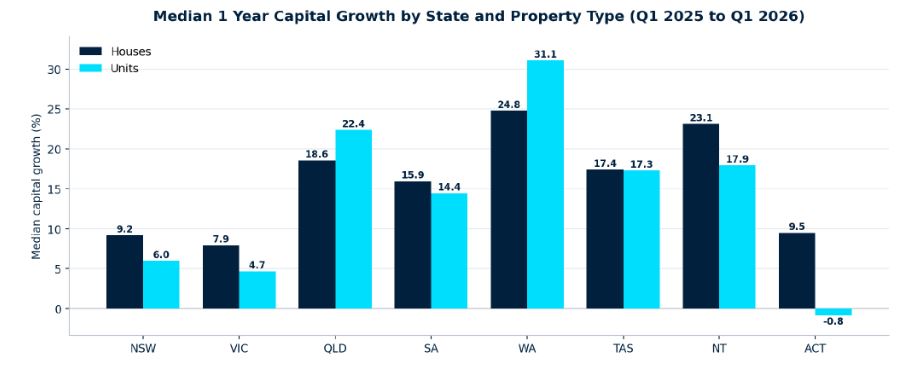


Median 1-year capital growth (Q1 2025 to Q1 2026) by state and property type, eligible postcode markets. Houses in navy, units in aqua.

The one-year picture is a tale of two economies. Western Australia leads the nation with median capital growth of 24.8% for house markets and 31.1% for unit markets, followed by the Northern Territory (23.1% houses) and Queensland (18.6% houses, 22.4% units). Tasmania and South Australia also posted strong mid-teen medians. By contrast, New South Wales (9.2% houses), Victoria (7.9% houses) and the ACT (9.5% houses, with unit markets marginally negative at -0.8%) grew at less than half the pace of the resource-state leaders. Medians above 20% in any state deserve a sceptical read: growth at that pace is rarely sustained, and some of it reflects smaller capital city and regional markets catching up from a lower base.


The 10-year view reorders the field. Queensland (8.8% houses) and Tasmania (8.5% houses) hold the strongest long-term medians, with South Australia close behind, while Western Australia's long-term house median of 5.6% is middling despite its current momentum: a reminder that WA's present surge follows a long flat stretch. The Northern Territory's 10-year medians (1.2% houses, -1.2% units) show that today's strong NT momentum sits on a weak decade, so NT figures in the leader tables warrant extra due diligence. Nationally, houses have out-compounded units over the decade in every state.

Median vacancy rate by state, postcode level (April to June 2026 monthly average). Vacancy is a single postcode level series, not split by property type.


Vacancy remains tight almost everywhere. The Northern Territory (0.32%), Tasmania (0.50%), Western Australia (0.66%) and South Australia (0.70%) have median postcode vacancy well under 1%, while New South Wales (1.15%), Victoria (1.13%) and the ACT (1.09%) sit only modestly above it. Note that vacancy is postcode level and a single series per postcode; it cannot distinguish house and unit rental conditions.

Share of eligible postcode markets with an average vacancy rate below 1%, by state (April to June 2026).


The share of postcodes under 1% vacancy makes the same point more starkly: every eligible NT postcode, 93% of Tasmanian postcodes and 77% of WA postcodes are below 1%, against 38% in New South Wales and 36% in Victoria. Tight vacancy across so much of the country suggests rental-market pressure will remain a feature of the investment landscape through 2026, particularly outside the two largest capitals. Capital growth leaders The four tables below rank the top 20 eligible markets by one-year and 10-year annualised capital growth, for houses and units separately. Where a postcode appears in both the one-year and 10-year tables (for example postcode 4184 on the Moreton Bay islands, or 4209 in the Coomera to Pimpama corridor), recent momentum is backed by a long-term track record, which is worth further investigation. Where a market shows strong recent capital growth but a flat decade (for example postcode 3039 Moonee Ponds units, 37.9% over the year against 0.8% annualised over ten years), the momentum has no track record behind it and requires additional due diligence. Several of the strongest one-year figures also sit in broad rural or island postcodes where conditions vary widely across localities; these should not be treated as a standalone buy signal. Min Qtr Sales, the lower of the two quarterly settled-sales counts, is shown as the market-depth indicator: a higher figure means stronger market depth behind the growth estimate.


Table 4.1: Top 20 house markets by 1-year capital growth

Postcode

Key Localities

State

Property Type

1 Year Growth %

10 Yr Annualized Growth %

Vacancy Rate %

Min Qtr Sales

6028

Burns Beach, Currambine, Iluka, Kinross

WA

House

38.7

5.8

0.95

57

6027

Beldon, Connolly, Edgewater, Heathridge, Joondalup

WA

House

37.9

5.2

0.72

85

4184

Coochiemudlo Island, Karragarra Island, Lamb Island, Macleay Island, Peel Island

QLD

House

37.9

19.4

4.24

137

4871

Almaden, Aloomba, Aurukun, Basilisk, Bellenden Ker

QLD

House

37.5

4.2

0.67

30

2360

Auburn Vale, Bukkulla, Cherry Tree Hill, Copeton, Elsmore

NSW

House

36.8

5.3

0.24

70

6110

Gosnells, Huntingdale, Martin, Southern River

WA

House

36.4

5.9

0.53

67

4124

Boronia Heights, Greenbank, Lyons, New Beith, Silverbark Ridge

QLD

House

36.2

10.3

1.78

72

4064

Paddington, Rosalie, Baroona, Milton

QLD

House

35.5

9.1

0.62

31

6020

Carine, Marmion, North Beach, Sorrento, Watermans Bay

WA

House

35.4

6.5

0.59

42

3825

Aberfeldy, Amor, Caringal, Coalville, Coopers Creek

VIC

House

35.3

8.8

2.10

45

7248

Alanvale, Inveresk, Invermay, Mayfield, Mowbray

TAS

House

34.1

8.7

0.65

49

6109

Maddington, Orange Grove

WA

House

33.9

6.2

0.67

31

4816

Alligator Creek, Balgal Beach, Brookhill, Buchanan, Calcium

QLD

House

33.7

7.3

0.19

34

6064

Alexander Heights, Girrawheen, Koondoola, Marangaroo

WA

House

33.6

4.9

0.36

49

2820

Gollan, Lake Burrendong, Maryvale, Montefiores, Mookerawa

NSW

House

33.3

8.0

3.59

38

6111

Canning Mills, Champion Lakes, Karragullen, Kelmscott, Roleystone

WA

House

33.1

5.1

0.73

66

4113

Eight Mile Plains, Fruitgrove, Runcorn

QLD

House

32.6

8.2

0.94

43

4553

Diamond Valley, Glenview, Mooloolah, Mooloolah Valley, Palmview

QLD

House

32.4

12.1

0.86

55

4125

Munruben, Park Ridge, Park Ridge South

QLD

House

32.1

6.7

1.05

31

3672

Benalla, Benalla West

VIC

House

32.0

7.0

2.70

34


Table 4.2: Top 20 unit markets by 1-year capital growth

Postcode

Key Localities

State

Property Type

1 Year Growth %

10 Yr Annualized Growth %

Vacancy Rate %

Min Qtr Sales

6230

Bunbury, Carey Park, College Grove, Dalyellup, Davenport

WA

Unit

39.2

5.2

0.73

34

3039

Moonee Ponds

VIC

Unit

37.9

0.8

0.83

35

6018

Churchlands, Doubleview, Gwelup, Innaloo, Karrinyup

WA

Unit

36.2

3.0

0.64

35

4510

Balingool, Beachmere, Bellmere, Caboolture, Caboolture South

QLD

Unit

35.6

8.1

0.84

40

6005

Kings Park, West Perth

WA

Unit

35.1

1.1

1.20

56

4007

Ascot, Brisbane Airport, Doomben, Hamilton, Hamilton Central

QLD

Unit

34.8

3.7

0.68

81

6056

Baskerville, Bellevue, Boya, Greenmount, Helena Valley

WA

Unit

34.5

4.7

0.44

32

6004

East Perth

WA

Unit

33.0

1.9

0.96

81

4350

Wellcamp, Westbrook, Wilsonton, Athol, Blue Mountain Heights

QLD

Unit

32.8

5.5

0.60

130

6168

Cooloongup, East Rockingham, Garden Island, Hillman, Peron

WA

Unit

32.5

6.9

0.55

34

6103

Rivervale

WA

Unit

32.3

2.7

0.74

47

2034

Coogee, South Coogee

NSW

Unit

32.1

5.4

2.13

53

4224

Tugun, Tugun Heights

QLD

Unit

31.5

10.8

1.33

30

6210

Clifton, Barragup, Bouvard, Coodanup, Dawesville

WA

Unit

31.2

5.7

1.40

60

2300

Bar Beach, Cooks Hill, Newcastle, Newcastle East, The Hill

NSW

Unit

31.2

5.9

1.40

52

6000

Perth, Perth Gpo

WA

Unit

30.9

2.0

1.00

92

4207

Alberton, Bahrs Scrub, Bannockburn, Beenleigh, Belivah

QLD

Unit

30.4

9.8

0.68

96

4812

Currajong, Gulliver, Hermit Park, Hyde Park, Hyde Park Castletown

QLD

Unit

30.3

5.0

0.59

46

4105

Clifton Hill, Moorooka, Moorvale, Tennyson, Yeerongpilly

QLD

Unit

30.3

6.1

0.70

30

4032

Chermside, Chermside South, Chermside West, Craigslea

QLD

Unit

29.9

4.6

0.46

75


Table 4.3: Top 20 house markets by 10-year annualised capital growth

Postcode

Key Localities

State

Property Type

1 Year Growth %

10 Yr Annualized Growth %

Vacancy Rate %

Min Qtr Sales

4184

Coochiemudlo Island, Karragarra Island, Lamb Island, Macleay Island, Peel Island

QLD

House

37.9

19.4

4.24

137

4209

Canowindra, Coomera, Pimpama, Upper Coomera, Willow Vale

QLD

House

22.8

14.9

0.46

250

2265

Cooranbong, Martinsville

NSW

House

10.5

14.9

3.16

34

2487

Casuarina, Chinderah, Cudgen, Duranbah, Fingal Head

NSW

House

10.2

14.3

2.03

41

3809

Officer, Officer South

VIC

House

-2.2

12.8

1.50

81

5113

Davoren Park, Davoren Park North, Davoren Park South, Elizabeth Downs, Elizabeth North

SA

House

18.2

12.5

0.84

73

4280

Jimboomba, Maclean, North Maclean, South Maclean, Stockleigh

QLD

House

9.8

12.4

3.07

85

4553

Diamond Valley, Glenview, Mooloolah, Mooloolah Valley, Palmview

QLD

House

32.4

12.1

0.86

55

2179

Austral, Leppington

NSW

House

14.5

12.0

4.82

38

4566

Munna Point, Noosaville

QLD

House

-12.2

12.0

2.91

32

4573

Coolum Beach, Marcus Beach, Mount Coolum, Peregian Beach, Peregian Beach South

QLD

House

10.2

11.8

0.97

132

4306

Blackbutt North, Blackbutt South, Blacksoil, Blackwall, Borallon

QLD

House

23.5

11.8

1.30

171

4567

Castaways Beach, Little Cove, Noosa Heads, Sunrise Beach, Sunshine Beach

QLD

House

-5.3

11.8

4.34

39

4519

Beerwah, Coochin Creek, Crohamhurst, Peachester

QLD

House

22.3

11.7

0.48

36

4207

Alberton, Bahrs Scrub, Bannockburn, Beenleigh, Belivah

QLD

House

22.6

11.7

0.68

278

2557

Catherine Field, Rossmore, Gregory Hills, Gledswood Hills

NSW

House

12.3

11.5

1.32

47

2321

Berry Park, Butterwick, Clarence Town, Cliftleigh, Duckenfield

NSW

House

10.8

11.4

1.98

77

4615

Barker Creek Flat, Brooklands, Bullcamp, East Nanango, Elgin Vale

QLD

House

10.5

11.4

0.40

39

5112

Elizabeth, Elizabeth East, Elizabeth Grove, Elizabeth South, Elizabeth Vale

SA

House

10.0

11.3

0.82

73

2762

Schofields, Tallawong

NSW

House

5.9

11.3

1.90

59


Table 4.4: Top 20 unit markets by 10-year annualised capital growth

Postcode

Key Localities

State

Property Type

1 Year Growth %

10 Yr Annualized Growth %

Vacancy Rate %

Min Qtr Sales

4567

Castaways Beach, Little Cove, Noosa Heads, Sunrise Beach, Sunshine Beach

QLD

Unit

25.4

11.2

4.34

57

4221

Elanora, Palm Beach

QLD

Unit

16.7

10.9

1.63

78

4224

Tugun, Tugun Heights

QLD

Unit

31.5

10.8

1.33

30

4220

Burleigh Heads, Burleigh Town, Burleigh Waters, Miami, Tally Valley

QLD

Unit

17.1

10.2

2.47

119

4207

Alberton, Bahrs Scrub, Bannockburn, Beenleigh, Belivah

QLD

Unit

30.4

9.8

0.68

96

2486

Banora Point, Bilambil, Bilambil Heights, Bungalora, Carool

NSW

Unit

8.6

9.7

0.60

55

4214

Arundel, Ashmore, Ashmore City, Molendinar, Parkwood

QLD

Unit

12.5

9.5

1.10

44

2485

Tweed Heads, Tweed Heads West

NSW

Unit

18.2

9.4

0.60

77

4573

Coolum Beach, Marcus Beach, Mount Coolum, Peregian Beach, Peregian Beach South

QLD

Unit

14.3

9.4

0.97

70

4566

Munna Point, Noosaville

QLD

Unit

2.3

9.2

2.91

36

4218

Broadbeach, Broadbeach Waters, Cypress Gardens, Florida Gardens, Mermaid Beach

QLD

Unit

9.6

9.0

3.39

192

4564

Marcoola, Mudjimba, Pacific Paradise, Twin Waters

QLD

Unit

29.6

9.0

0.68

33

2487

Casuarina, Chinderah, Cudgen, Duranbah, Fingal Head

NSW

Unit

25.4

8.9

2.03

46

4127

Chatswood Hills, Daisy Hill, Priestdale, Slacks Creek, Springwood

QLD

Unit

27.7

8.8

0.62

41

4211

Advancetown, Beechmont, Binna Burra, Carrara, Clagiraba

QLD

Unit

17.7

8.7

0.86

107

4508

Deception Bay

QLD

Unit

26.1

8.6

0.68

38

4209

Canowindra, Coomera, Pimpama, Upper Coomera, Willow Vale

QLD

Unit

24.9

8.6

0.46

82

4655

Booral, Bunya Creek, Craignish, Dundowran, Dundowran Beach

QLD

Unit

13.1

8.4

2.32

78

4227

Reedy Creek, Varsity Lakes

QLD

Unit

21.8

8.4

0.63

69

4558

Cotton Tree, Kuluin, Maroochydore, Maroochydore South

QLD

Unit

19.1

8.2

0.74

111


Rental pressure markets


The tables below rank eligible postcodes by vacancy rate, with ties broken by one-year capital growth. Each postcode appears once; where a postcode has both an eligible house and unit market, the property type shown is the one with the stronger one-year capital growth. Because vacancy is a rental measure that settled-sales counts do not validate, these tables end at the vacancy column. Tight-vacancy postcodes, several recording effectively zero average vacancy across the quarter, suggest sustained rental-market pressure; the high-vacancy list is a caution flag, with postcode 3335 (Rockbank and Thornhill Park growth corridor, 15.2% vacancy) and 4659 (Burrum Heads, 9.1%) illustrating how new supply or holiday-market dynamics can leave landlords competing for tenants even where capital growth remains positive.


Table 5.1: Top 20 lowest-vacancy postcodes

Postcode

Key Localities

State

Property Type

1 Year Growth %

10 Yr Annualized Growth %

Vacancy Rate %

4715

Biloela, Callide, Castle Creek, Dakenba, Dumgree

QLD

House

24.3

2.0

0.00

4555

Chevallum, Hunchy, Landers Shoot, Palmwoods

QLD

House

14.2

8.5

0.05

2705

Brobenah, Calorafield, Corbie Hill, Gogeldrie, Leeton

NSW

House

10.6

7.0

0.12

3564

Campaspe West, Echuca, Echuca East, Echuca South, Echuca Village

VIC

House

0.9

7.1

0.13

7109

Catamaran, Crabtree, Cradoc, Glaziers Bay, Glen Huon

TAS

House

8.2

7.5

0.13

6054

Ashfield, Bassendean, Eden Hill, Kiara, Lockridge

WA

House

24.5

5.0

0.15

3465

Adelaide Lead, Alma, Bowenvale, Bung Bong, Cotswold

VIC

House

4.8

7.7

0.15

5125

Golden Grove, Golden Grove Village, Greenwith

SA

House

8.2

7.6

0.16

3140

Lilydale

VIC

House

8.0

4.5

0.16

5043

Ascot Park, Marion, Mitchell Park, Morphettville, Park Holme

SA

House

11.8

7.9

0.17

7030

Apsley, Arthurs Lake, Bagdad, Bagdad North, Bothwell

TAS

House

10.8

10.3

0.18

4816

Alligator Creek, Balgal Beach, Brookhill, Buchanan, Calcium

QLD

House

33.7

7.3

0.19

5162

Morphett Vale, Woodcroft

SA

House

18.5

9.0

0.19

0812

Karama, Leanyer, Malak, Marrara, Northlakes

NT

House

21.9

1.2

0.20

3777

Badger Creek, Castella, Chum Creek, Healesville, Healesville Main Street

VIC

House

-10.8

5.1

0.20

7009

Derwent Park, Lutana, Moonah, West Moonah

TAS

House

17.4

8.3

0.23

2360

Auburn Vale, Bukkulla, Cherry Tree Hill, Copeton, Elsmore

NSW

House

36.8

5.3

0.24

5540

Bungama, Coonamia, Napperby, Nelshaby, Port Davis

SA

House

3.9

5.7

0.24

7010

Dowsing Point, Elwick, Glenorchy, Goodwood, Montrose

TAS

House

16.7

8.7

0.25

0810

Alawa, Brinkin, Casuarina, Jingili, Lee Point

NT

House

28.1

1.6

0.25


Table 5.2: Top 20 highest-vacancy postcodes

Postcode

Key Localities

State

Property Type

1 Year Growth %

10 Yr Annualized Growth %

Vacancy Rate %

3335

Plumpton, Rockbank, Bonnie Brook, Grangefields, Thornhill Park

VIC

House

15.8

5.8

15.22

4659

Beelbi Creek, Burgowan, Burrum, Burrum Heads, Burrum River

QLD

House

7.3

10.4

9.08

4744

Moranbah, Peak Downs Mine

QLD

House

11.3

8.1

8.60

2537

Bergalia, Bingie, Broulee, Coila, Congo

NSW

House

6.8

9.3

5.85

3024

Mambourin, Mount Cottrell, Wyndham Vale, Fieldstone, Manor Lakes

VIC

House

1.9

6.8

5.73

6211

Bouvard, Dawesville, Herron, Clifton

WA

House

26.9

6.5

5.36

3730

Bathumi, Boosey, Bundalong, Bundalong South, Esmond

VIC

House

17.4

7.2

5.33

3338

Brookfield, Exford, Eynesbury, Melton South, Cobblebank

VIC

House

12.6

9.9

5.08

2027

Darling Point, Edgecliff, Hmas Rushcutters, Point Piper

NSW

Unit

-25.8

1.5

5.00

3941

Rye, St Andrews Beach, Tootgarook

VIC

House

-1.8

6.9

4.94

2179

Austral, Leppington

NSW

House

14.5

12.0

4.82

2000

Darling Harbour, Dawes Point, Haymarket, Millers Point, Parliament House

NSW

Unit

0.7

-0.1

4.58

4567

Castaways Beach, Little Cove, Noosa Heads, Sunrise Beach, Sunshine Beach

QLD

Unit

25.4

11.2

4.34

4184

Coochiemudlo Island, Karragarra Island, Lamb Island, Macleay Island, Peel Island

QLD

House

37.9

19.4

4.24

2026

Ben Buckler, Bondi, Bondi Beach, North Bondi, Tamarama

NSW

Unit

17.1

4.6

4.22

3936

Arthurs Seat, Dromana, Safety Beach

VIC

House

10.2

6.4

4.10

3840

Driffield, Hazelwood, Hazelwood North, Hazelwood South, Jeeralang

VIC

House

25.0

8.4

3.88

2765

Berkshire Park, Box Hill, Maraylya, Marsden Park, Nelson

NSW

House

9.2

7.8

3.86

4217

Benowa, Bundall, Chevron Island, Gold Coast Mc, Isle Of Capri

QLD

Unit

20.0

7.7

3.83

2850

Aarons Pass, Apple Tree Flat, Avisford, Bara, Barigan

NSW

House

-0.3

7.7

3.68


Balanced growth and rental demand markets

The Balanced Score is a screening tool, not a recommendation. From the eligible universe we keep only markets with positive one-year capital growth, positive 10-year annualised capital growth and a vacancy rate at or below the national median of 1.00%; 415 markets qualified this quarter. Within that pool, one-year capital growth, 10-year capital growth and inverted vacancy are each min-max scaled, then combined as 35% one-year, 35% ten-year and 30% inverted vacancy, and expressed out of 100. A high score therefore indicates a market where recent momentum, a long-term capital growth record and tight rental conditions currently coincide; it says nothing about price point, yield, stock quality or forward risk, all of which require additional due diligence.


Queensland dominates both lists. Postcode 4209 (Coomera, Pimpama and Upper Coomera) tops the house table with strong scores on all three legs and exceptional market depth (250 settled sales in the thinner quarter), while Townsville's rural fringe (4816) and the Inverell district (2360) follow on tighter vacancy; both are broad regional postcodes that warrant extra due diligence. On the unit side, Brisbane's affordable south west (4077 Inala and Durack) and the Beenleigh corridor (4207) lead, combining near-30% one-year capital growth with sub-0.7% vacancy.

Table 6.1: Top 20 balanced house markets

Postcode

Key Localities

State

Property Type

1 Year Growth %

10 Yr Annualized Growth %

Vacancy Rate %

Min Qtr Sales

Balanced Score

4209

Canowindra, Coomera, Pimpama, Upper Coomera, Willow Vale

QLD

House

22.8

14.9

0.46

250

71.3

4816

Alligator Creek, Balgal Beach, Brookhill, Buchanan, Calcium

QLD

House

33.7

7.3

0.19

34

70.5

2360

Auburn Vale, Bukkulla, Cherry Tree Hill, Copeton, Elsmore

NSW

House

36.8

5.3

0.24

70

66.9

4370

Clintonvale, Cunningham, Elbow Valley, Freestone, Gladfield

QLD

House

26.4

9.0

0.27

93

65.7

5038

Camden Park, Plympton, Plympton Park, South Plympton

SA

House

31.2

8.1

0.40

36

63.9

4064

Paddington, Rosalie, Baroona, Milton

QLD

House

35.5

9.1

0.62

31

63.4

4054

Arana Hills, Grovely, Keperra

QLD

House

24.9

8.8

0.28

47

63.4

4519

Beerwah, Coochin Creek, Crohamhurst, Peachester

QLD

House

22.3

11.7

0.48

36

62.4

7011

Austins Ferry, Berriedale, Chigwell, Claremont

TAS

House

23.9

8.3

0.25

43

62.2

4164

Pinklands, Thornlands

QLD

House

26.7

10.1

0.50

54

61.7

5162

Morphett Vale, Woodcroft

SA

House

18.5

9.0

0.19

85

60.9

4553

Diamond Valley, Glenview, Mooloolah, Mooloolah Valley, Palmview

QLD

House

32.4

12.1

0.86

55

60.7

4077

Doolandella, Durack, Inala, Inala East, Inala Heights

QLD

House

21.8

10.0

0.39

50

60.4

7248

Alanvale, Inveresk, Invermay, Mayfield, Mowbray

TAS

House

34.1

8.7

0.65

49

60.2

6036

Butler, Jindalee

WA

House

28.7

5.9

0.27

54

60.1

4555

Chevallum, Hunchy, Landers Shoot, Palmwoods

QLD

House

14.2

8.5

0.05

32

60.0

4500

Bray Park, Brendale, Cashmere, Clear Mountain, Joyner

QLD

House

27.3

8.8

0.48

142

59.5

6021

Balcatta, Stirling

WA

House

28.6

6.7

0.35

44

59.4

6064

Alexander Heights, Girrawheen, Koondoola, Marangaroo

WA

House

33.6

4.9

0.36

49

59.4

4304

Blackstone, Booval, Booval Fair, Bundamba, Ebbw Vale

QLD

House

28.2

9.8

0.60

85

59.3


Table 6.2: Top 20 balanced unit markets

Postcode

Key Localities

State

Property Type

1 Year Growth %

10 Yr Annualized Growth %

Vacancy Rate %

Min Qtr Sales

Balanced Score

4077

Doolandella, Durack, Inala, Inala East, Inala Heights

QLD

Unit

29.8

6.7

0.39

50

59.5

4207

Alberton, Bahrs Scrub, Bannockburn, Beenleigh, Belivah

QLD

Unit

30.4

9.8

0.68

96

59.1

6168

Cooloongup, East Rockingham, Garden Island, Hillman, Peron

WA

Unit

32.5

6.9

0.55

34

57.4

4209

Canowindra, Coomera, Pimpama, Upper Coomera, Willow Vale

QLD

Unit

24.9

8.6

0.46

82

57.3

6056

Baskerville, Bellevue, Boya, Greenmount, Helena Valley

WA

Unit

34.5

4.7

0.44

32

57.1

4564

Marcoola, Mudjimba, Pacific Paradise, Twin Waters

QLD

Unit

29.6

9.0

0.68

33

56.3

4127

Chatswood Hills, Daisy Hill, Priestdale, Slacks Creek, Springwood

QLD

Unit

27.7

8.8

0.62

41

55.9

6060

Dog Swamp, Joondanna, Tuart Hill, Yokine, Yokine South

WA

Unit

28.7

4.2

0.30

45

54.7

4510

Balingool, Beachmere, Bellmere, Caboolture, Caboolture South

QLD

Unit

35.6

8.1

0.84

40

54.5

6230

Bunbury, Carey Park, College Grove, Dalyellup, Davenport

WA

Unit

39.2

5.2

0.73

34

53.9

4350

Wellcamp, Westbrook, Wilsonton, Athol, Blue Mountain Heights

QLD

Unit

32.8

5.5

0.60

130

52.9

4503

Dakabin, Dohles Rocks, Griffin, Kallangur, Kurwongbah

QLD

Unit

28.0

6.3

0.52

76

52.9

4508

Deception Bay

QLD

Unit

26.1

8.6

0.68

38

52.2

4032

Chermside, Chermside South, Chermside West, Craigslea

QLD

Unit

29.9

4.6

0.46

75

52.1

4053

Everton Hills, Everton Park, McDowall, Mitchelton, Oxford Park

QLD

Unit

26.8

5.6

0.48

68

51.2

4031

Glen Kedron, Gordon Park, Kedron

QLD

Unit

27.9

4.6

0.45

42

50.6

4812

Currajong, Gulliver, Hermit Park, Hyde Park, Hyde Park Castletown

QLD

Unit

30.3

5.0

0.59

46

49.7

4500

Bray Park, Brendale, Cashmere, Clear Mountain, Joyner

QLD

Unit

22.7

6.4

0.48

48

49.5

4020

Redcliffe, Redcliffe North, Scarborough, Newport

QLD

Unit

26.5

6.7

0.62

60

49.5

2485

Tweed Heads, Tweed Heads West

NSW

Unit

18.2

9.4

0.60

77

49.3


Watchlist markets

These three tables are monitoring lists, not opportunity lists. They isolate markets where the signals disagree, and disagreement is exactly where assumptions should be tested before capital is committed. The thresholds are data driven and recomputed each quarter on the eligible universe: tight vacancy is the 25th percentile (0.68% this quarter), high vacancy is the 75th percentile (1.53%), a strong long-term record is the 75th percentile of 10-year annualised capital growth (8.1%), and weak recent momentum is one-year capital growth at or below a fixed 2.0%.


Table 7.1: Rental pressure without momentum (vacancy at or below 0.68% and 1-year capital growth at or below 2.0%)


Sixteen markets combine very tight rental conditions with flat or negative recent capital growth. Tight vacancy suggests rental-market pressure and can precede price growth, but it can also persist for years in small regional markets without translating into capital growth; treat these as markets to watch, not to chase.

Postcode

Key Localities

State

Property Type

1 Year Growth %

10 Yr Annualized Growth %

Vacancy Rate %

Min Qtr Sales

3564

Campaspe West, Echuca, Echuca East, Echuca South, Echuca Village

VIC

House

0.9

7.1

0.13

44

3777

Badger Creek, Castella, Chum Creek, Healesville, Healesville Main Street

VIC

House

-10.8

5.1

0.20

30

0832

Gunn, Mitchell, Rosebery, Rosebery Heights, Bakewell

NT

Unit

-2.3

-0.8

0.30

42

0870

Alice Springs, Araluen, Braitling, Ciccone, Desert Springs

NT

House

-2.0

0.8

0.32

37

3139

Beenak, Don Valley, Hoddles Creek, Launching Place, Seville

VIC

House

1.1

6.3

0.38

32

3136

Croydon, Croydon Hills, Croydon North, Croydon South

VIC

Unit

0.8

4.7

0.49

70

2478

Ballina, Coolgardie, Cumbalum, East Ballina, Empire Vale

NSW

House

-0.9

9.5

0.50

87

6156

Attadale, Melville, Willagee, Willagee Central

WA

House

0.0

7.5

0.50

31

3088

Briar Hill, Greensborough, Saint Helena, St Helena

VIC

House

-1.0

5.0

0.59

50

3070

Northcote, Northcote South

VIC

Unit

-3.2

1.4

0.60

39

3070

Northcote, Northcote South

VIC

House

-0.3

4.9

0.60

32

3178

Rowville

VIC

House

-0.5

5.2

0.61

50

3195

Aspendale, Aspendale Gardens, Braeside, Mordialloc, Mordialloc North

VIC

Unit

-6.6

3.7

0.61

48

3195

Aspendale, Aspendale Gardens, Braeside, Mordialloc, Mordialloc North

VIC

House

-4.1

5.9

0.61

42

2484

Back Creek, Boat Harbour, Bray Park, Brays Creek, Byangum

NSW

House

-3.9

10.3

0.63

67

3194

Mentone, Mentone East, Moorabbin Airport

VIC

Unit

-26.2

3.4

0.66

34


Table 7.2: Cooling long-term performers (10-year annualised capital growth at or above 8.1% and 1-year capital growth at or below 2.0%)


Sixteen markets with a top-quartile decade have stalled over the past year, including Officer (3809) and Noosaville (4566). A strong decade followed by a flat year can mark a pause, a peak or a rotation of demand; the direction is not knowable from two data points, which is precisely why these sit on a watchlist.


Postcode

Key Localities

State

Property Type

1 Year Growth %

10 Yr Annualized Growth %

Vacancy Rate %

Min Qtr Sales

3809

Officer, Officer South

VIC

House

-2.2

12.8

1.50

81

4566

Munna Point, Noosaville

QLD

House

-12.2

12.0

2.91

32

4567

Castaways Beach, Little Cove, Noosa Heads, Sunrise Beach, Sunshine Beach

QLD

House

-5.3

11.8

4.34

39

2484

Back Creek, Boat Harbour, Bray Park, Brays Creek, Byangum

NSW

House

-3.9

10.3

0.63

67

2483

Billinudgel, Brunswick Heads, Burringbar, Crabbes Creek, Middle Pocket

NSW

House

-0.4

10.1

0.75

40

2539

Bawley Point, Bendalong, Berringer Lake, Burrill Lake, Conjola

NSW

House

-2.4

9.6

2.07

100

2478

Ballina, Coolgardie, Cumbalum, East Ballina, Empire Vale

NSW

House

-0.9

9.5

0.50

87

4060

Ashgrove, Ashgrove West, Dorrington, St Johns Wood, Ashgrove East

QLD

House

-0.7

9.2

1.15

32

4070

Anstead, Bellbowrie, Moggill, Priors Pocket

QLD

House

1.0

9.0

2.38

30

2463

Ashby, Ashby Heights, Brooms Head, Gulmarrad, Ilarwill

NSW

House

-3.3

9.0

1.13

39

2546

Akolele, Barragga Bay, Beauty Point, Bermagui, Bermagui South

NSW

House

-0.8

9.0

2.24

42

2575

Alpine, Aylmerton, Barrallier, Braemar, Bullio

NSW

House

-8.6

9.0

1.03

80

2620

Burbong, Burra, Carwoola, Clear Range, Dodsworth

NSW

House

0.0

8.7

1.18

108

2291

Merewether, Merewether Heights, The Junction

NSW

House

-13.2

8.5

1.36

39

2155

Beaumont Hills, Kellyville, Kellyville Ridge, Rouse Hill, North Kellyville

NSW

House

1.4

8.4

1.75

165

2590

Bethungra, Cootamundra, Illabo

NSW

House

-3.4

8.4

1.19

35


Table 7.3: High-vacancy risk (vacancy at or above 1.53% and 1-year capital growth at or below 2.0%)


Forty five markets combine elevated vacancy with weak recent capital growth, the least comfortable pairing in this report; the table lists the 20 with the highest vacancy. Softer tenant demand alongside stalling prices increases holding risk, and any exposure here should be underpinned by asset-specific and locality-specific work rather than postcode level figures.


Postcode

Key Localities

State

Property Type

1 Year Growth %

10 Yr Annualized Growth %

Vacancy Rate %

Min Qtr Sales

3024

Mambourin, Mount Cottrell, Wyndham Vale, Fieldstone, Manor Lakes

VIC

House

1.9

6.8

5.73

137

2027

Darling Point, Edgecliff, Hmas Rushcutters, Point Piper

NSW

Unit

-25.8

1.5

5.00

33

3941

Rye, St Andrews Beach, Tootgarook

VIC

House

-1.8

6.9

4.94

60

2000

Darling Harbour, Dawes Point, Haymarket, Millers Point, Parliament House

NSW

Unit

0.7

-0.1

4.58

138

4567

Castaways Beach, Little Cove, Noosa Heads, Sunrise Beach, Sunshine Beach

QLD

House

-5.3

11.8

4.34

39

2850

Aarons Pass, Apple Tree Flat, Avisford, Bara, Barigan

NSW

House

-0.3

7.7

3.68

81

4566

Munna Point, Noosaville

QLD

House

-12.2

12.0

2.91

32

2033

Kensington

NSW

Unit

-7.6

2.2

2.61

32

2602

Ainslie, Dickson, Downer, Hackett, Lyneham

ACT

Unit

-2.9

3.7

2.45

41

2075

North St Ives, St Ives, St Ives Chase

NSW

House

-8.0

6.9

2.45

50

4070

Anstead, Bellbowrie, Moggill, Priors Pocket

QLD

House

1.0

9.0

2.38

30

2315

Corlette, Fingal Bay, Gan Gan, Nelson Bay, Shoal Bay

NSW

Unit

-1.1

7.2

2.38

45

2022

Bondi Junction, Queens Park

NSW

Unit

-9.1

3.6

2.34

31

3223

Indented Head, Portarlington, St Leonards, Bellarine

VIC

House

1.3

7.2

2.34

51

2037

Forest Lodge, Glebe

NSW

Unit

-8.6

1.4

2.26

48

2546

Akolele, Barragga Bay, Beauty Point, Bermagui, Bermagui South

NSW

House

-0.8

9.0

2.24

42

3059

Greenvale

VIC

House

1.6

7.3

2.23

52

2074

Bobbin Head, North Turramurra, South Turramurra, Turramurra, Warrawee

NSW

House

-1.0

6.1

2.21

49

3008

Docklands

VIC

Unit

-8.1

-1.4

2.16

83

2260

Erina Heights, Forresters Beach, North Avoca, Terrigal, Wamberal

NSW

House

0.5

7.7

2.13

82


House versus unit comparison

For postcodes with both an eligible house and an eligible unit market, the tables below show the largest performance gaps in each direction, over one year and over ten years. A positive Diff means houses outperformed units; a negative Diff means units outperformed houses. The one-year gaps can be striking: in Leichhardt and Lilyfield (2040) houses gained 15.2% capital growth while units fell 17.1%, a 32.4 point gap, while in Noosa Heads (4567) units gained 25.4% against a 5.3% fall for houses. Gaps this wide are often composition effects, differences in the stock transacting from one year to the next, rather than clean price divergence, and they should not be treated as a standalone buy signal for the lagging or leading segment. The 10-year tables are the more reliable read on structural preference between the two property types within a postcode.

Table 8.1: Largest 1-year gaps where houses outperformed units

Postcode

Key Localities

State

House 1 Yr Growth %

Unit 1 Yr Growth %

Diff 1yr

House 10 Yr Growth % p.a.

Unit 10 Yr Growth % p.a.

Diff 10yr

Vacancy Rate %

2040

Leichhardt, Lilyfield

NSW

15.2

-17.1

+32.4

5.7

1.8

+3.9

0.88

0832

Gunn, Mitchell, Rosebery, Rosebery Heights, Bakewell

NT

23.1

-2.3

+25.4

1.0

-0.8

+1.8

0.30

3196

Bonbeach, Chelsea, Chelsea Heights, Edithvale

VIC

19.5

-4.4

+23.9

5.2

4.5

+0.6

0.70

4868

Bayview Heights, Mount Sheridan, Tarrawarra, White Rock, Woree

QLD

18.6

-3.2

+21.8

6.7

7.8

-1.1

0.76

2770

Bidwill, Blackett, Dharruk, Emerton, Hebersham

NSW

15.0

-4.9

+19.9

6.5

2.0

+4.5

0.75

3058

Batman, Coburg, Coburg North, Merlynston, Moreland

VIC

7.8

-11.3

+19.1

5.0

3.2

+1.7

0.79

3072

Gilberton, Preston, Preston Lower, Preston South, Preston West

VIC

15.1

-3.6

+18.7

4.2

2.2

+2.0

1.19

2602

Ainslie, Dickson, Downer, Hackett, Lyneham

ACT

14.9

-2.9

+17.8

5.4

3.7

+1.7

2.45

2148

Arndell Park, Blacktown, Blacktown Westpoint, Huntingwood, Kings Park

NSW

10.3

-4.1

+14.4

5.7

1.1

+4.6

1.14

3021

Albanvale, Kealba, Kings Park, St Albans

VIC

14.9

1.1

+13.8

6.2

5.3

+0.8

0.74

4557

Mooloolaba, Mountain Creek

QLD

20.0

6.9

+13.1

9.8

7.9

+1.9

0.40

3012

Brooklyn, Kingsville, Kingsville West, Maidstone, Tottenham

VIC

0.6

-12.4

+12.9

3.5

1.7

+1.9

1.04

2031

Clovelly, Clovelly West, Randwick, St Pauls

NSW

11.6

0.0

+11.6

6.2

4.5

+1.7

1.95

2165

Fairfield, Fairfield East, Fairfield Heights, Fairfield West

NSW

15.9

4.7

+11.2

5.7

0.3

+5.3

1.31

2760

Colyton, North St Marys, Oxley Park, St Marys, St Marys East

NSW

20.8

10.0

+10.8

6.3

5.2

+1.1

1.10

2117

Dundas, Dundas Valley, Oatlands, Telopea

NSW

-3.4

-13.8

+10.5

5.6

3.6

+2.0

0.94

2137

Breakfast Point, Cabarita, Concord, Mortlake, North Strathfield

NSW

1.2

-9.2

+10.4

5.9

1.5

+4.4

1.58

2620

Burbong, Burra, Carwoola, Clear Range, Dodsworth

NSW

0.0

-10.3

+10.3

8.7

3.5

+5.3

1.18

3040

Aberfeldie, Essendon, Essendon West

VIC

9.9

-0.4

+10.3

4.3

1.0

+3.3

1.05

2914

Amaroo, Bonner, Forde, Harrison, Jacka

ACT

9.5

-0.8

+10.3

5.5

4.2

+1.2

0.91


Table 8.2: Largest 1-year gaps where units outperformed houses

Postcode

Key Localities

State

House 1 Yr Growth %

Unit 1 Yr Growth %

Diff 1yr

House 10 Yr Growth % p.a.

Unit 10 Yr Growth % p.a.

Diff 10yr

Vacancy Rate %

4567

Castaways Beach, Little Cove, Noosa Heads, Sunrise Beach, Sunshine Beach

QLD

-5.3

25.4

-30.7

11.8

11.2

+0.5

4.34

2230

Bundeena, Burraneer, Cronulla, Maianbar, Woolooware

NSW

-11.1

14.4

-25.5

7.1

4.2

+2.9

1.80

4031

Glen Kedron, Gordon Park, Kedron

QLD

2.7

27.9

-25.2

9.2

4.6

+4.5

0.45

3175

Bangholme, Dandenong, Dandenong East, Dandenong North, Dandenong South

VIC

5.7

26.8

-21.1

4.9

3.3

+1.6

1.54

4103

Annerley, Fairfield, Fairfield Gardens, Thompson Estate

QLD

0.9

21.3

-20.3

7.6

5.7

+1.9

1.00

6230

Bunbury, Carey Park, College Grove, Dalyellup, Davenport

WA

19.5

39.2

-19.7

6.2

5.2

+0.9

0.73

2166

Cabramatta, Cabramatta West, Canley Heights, Canley Vale, Lansvale

NSW

6.9

25.0

-18.1

5.9

1.3

+4.6

1.40

4020

Redcliffe, Redcliffe North, Scarborough, Newport

QLD

8.7

26.5

-17.8

10.2

6.7

+3.5

0.62

2065

Crows Nest, Gore Hill, Greenwich, Naremburn, Royal North Shore Hospital

NSW

-1.6

16.2

-17.8

5.7

2.7

+3.1

1.77

2010

Darlinghurst, Surry Hills, Taylor Square

NSW

-11.8

5.7

-17.6

5.6

0.9

+4.7

1.67

2042

Enmore, Newtown

NSW

2.4

19.1

-16.7

4.3

2.7

+1.6

1.02

4510

Balingool, Beachmere, Bellmere, Caboolture, Caboolture South

QLD

19.4

35.6

-16.2

10.7

8.1

+2.6

0.84

4350

Wellcamp, Westbrook, Wilsonton, Athol, Blue Mountain Heights

QLD

17.1

32.8

-15.7

7.9

5.5

+2.4

0.60

4564

Marcoola, Mudjimba, Pacific Paradise, Twin Waters

QLD

14.1

29.6

-15.6

10.9

9.0

+1.9

0.68

2035

Maroubra, Maroubra South, Pagewood

NSW

-9.5

6.0

-15.5

5.9

3.3

+2.6

1.92

2487

Casuarina, Chinderah, Cudgen, Duranbah, Fingal Head

NSW

10.2

25.4

-15.2

14.3

8.9

+5.5

2.03

4068

Chelmer, Indooroopilly, Long Pocket, Taringa

QLD

3.8

18.7

-14.9

8.2

4.8

+3.5

1.86

4217

Benowa, Bundall, Chevron Island, Gold Coast Mc, Isle Of Capri

QLD

5.1

20.0

-14.9

10.8

7.7

+3.1

3.83

4566

Munna Point, Noosaville

QLD

-12.2

2.3

-14.6

12.0

9.2

+2.8

2.91

3155

Boronia

VIC

-0.5

13.1

-13.6

4.5

5.0

-0.5

0.70


Table 8.3: Largest 10-year gaps where houses outperformed units

Postcode

Key Localities

State

House 1 Yr Growth %

Unit 1 Yr Growth %

Diff 1yr

House 10 Yr Growth % p.a.

Unit 10 Yr Growth % p.a.

Diff 10yr

Vacancy Rate %

2155

Beaumont Hills, Kellyville, Kellyville Ridge, Rouse Hill, North Kellyville

NSW

1.4

4.7

-3.3

8.4

0.0

+8.4

1.75

2135

Strathfield

NSW

7.5

6.0

+1.5

6.8

0.3

+6.5

1.81

4209

Canowindra, Coomera, Pimpama, Upper Coomera, Willow Vale

QLD

22.8

24.9

-2.0

14.9

8.6

+6.4

0.46

2112

Denistone East, Putney, Ryde

NSW

8.1

6.9

+1.2

6.0

0.2

+5.8

1.17

4740

Alexandra, Alligator Creek, Andergrove, Bakers Creek, Balberra

QLD

13.8

22.5

-8.8

6.5

0.7

+5.8

1.11

4064

Paddington, Rosalie, Baroona, Milton

QLD

35.5

26.7

+8.8

9.1

3.3

+5.8

0.62

2118

Carlingford, Carlingford Court, Carlingford North, Kingsdene

NSW

2.9

4.2

-1.3

5.7

0.1

+5.6

1.03

2161

Guildford, Guildford West, Old Guildford, Yennora

NSW

7.6

4.6

+3.0

5.5

-0.0

+5.6

1.14

2487

Casuarina, Chinderah, Cudgen, Duranbah, Fingal Head

NSW

10.2

25.4

-15.2

14.3

8.9

+5.5

2.03

2121

Epping, North Epping

NSW

-11.4

-2.4

-9.0

5.1

-0.3

+5.4

1.16

2165

Fairfield, Fairfield East, Fairfield Heights, Fairfield West

NSW

15.9

4.7

+11.2

5.7

0.3

+5.3

1.31

2620

Burbong, Burra, Carwoola, Clear Range, Dodsworth

NSW

0.0

-10.3

+10.3

8.7

3.5

+5.3

1.18

2036

Chifley, Eastgardens, Hillsdale, La Perouse, Little Bay

NSW

-4.2

6.9

-11.1

6.3

1.1

+5.2

1.56

2145

Westmead, Girraween, Greystanes, Mays Hill, Pemulwuy

NSW

6.5

-0.8

+7.3

5.6

0.5

+5.0

1.15

4703

Adelaide Park, Bangalee, Barlows Hill, Barmaryee, Barmoya

QLD

18.4

21.2

-2.8

8.8

3.8

+5.0

0.89

2160

Merrylands, Merrylands West

NSW

6.0

10.5

-4.5

5.4

0.5

+5.0

1.48

2113

Blenheim Road, East Ryde, Macquarie Park, North Ryde

NSW

3.3

7.7

-4.5

6.0

1.2

+4.9

1.44

2010

Darlinghurst, Surry Hills, Taylor Square

NSW

-11.8

5.7

-17.6

5.6

0.9

+4.7

1.67

2200

Bankstown, Bankstown Airport, Bankstown North, Bankstown Square, Condell Park

NSW

1.6

12.3

-10.7

6.3

1.6

+4.6

0.70

2148

Arndell Park, Blacktown, Blacktown Westpoint, Huntingwood, Kings Park

NSW

10.3

-4.1

+14.4

5.7

1.1

+4.6

1.14


Table 8.4: Largest 10-year gaps where units outperformed houses

Postcode

Key Localities

State

House 1 Yr Growth %

Unit 1 Yr Growth %

Diff 1yr

House 10 Yr Growth % p.a.

Unit 10 Yr Growth % p.a.

Diff 10yr

Vacancy Rate %

4868

Bayview Heights, Mount Sheridan, Tarrawarra, White Rock, Woree

QLD

18.6

-3.2

+21.8

6.7

7.8

-1.1

0.76

4214

Arundel, Ashmore, Ashmore City, Molendinar, Parkwood

QLD

15.4

12.5

+2.9

8.8

9.5

-0.7

1.10

3073

Keon Park, Reservoir, Reservoir East, Reservoir North, Reservoir South

VIC

12.9

9.7

+3.1

4.2

4.8

-0.5

1.04

3155

Boronia

VIC

-0.5

13.1

-13.6

4.5

5.0

-0.5

0.70

4221

Elanora, Palm Beach

QLD

12.0

16.7

-4.7

10.5

10.9

-0.4

1.63

4127

Chatswood Hills, Daisy Hill, Priestdale, Slacks Creek, Springwood

QLD

22.0

27.7

-5.7

8.6

8.8

-0.2

0.62

4870

Aeroglen, Brinsmead, Bungalow, Cairns, Cairns Central

QLD

14.8

18.1

-3.3

6.1

6.2

-0.1

0.67

6168

Cooloongup, East Rockingham, Garden Island, Hillman, Peron

WA

26.0

32.5

-6.4

7.0

6.9

+0.0

0.55

2486

Banora Point, Bilambil, Bilambil Heights, Bungalora, Carool

NSW

17.4

8.6

+8.8

9.7

9.7

+0.0

0.60

3174

Noble Park, Noble Park East, Noble Park North

VIC

9.2

17.0

-7.8

5.1

5.1

+0.0

1.28

3153

Bayswater, Bayswater North

VIC

9.4

3.1

+6.3

4.4

4.3

+0.1

0.47

3216

Belmont, Freshwater Creek, Grovedale, Grovedale East, Highton

VIC

13.5

5.2

+8.3

6.1

5.9

+0.2

1.30

6210

Clifton, Barragup, Bouvard, Coodanup, Dawesville

WA

26.8

31.2

-4.5

6.0

5.7

+0.3

1.40

3136

Croydon, Croydon Hills, Croydon North, Croydon South

VIC

7.5

0.8

+6.8

5.0

4.7

+0.3

0.49

3550

Bendigo, Bendigo South, Diamond Hill, East Bendigo, Flora Hill

VIC

15.5

14.6

+0.9

6.2

5.8

+0.4

1.76

3046

Glenroy, Hadfield, Oak Park

VIC

5.3

15.1

-9.9

4.5

4.0

+0.5

0.67

4567

Castaways Beach, Little Cove, Noosa Heads, Sunrise Beach, Sunshine Beach

QLD

-5.3

25.4

-30.7

11.8

11.2

+0.5

4.34

4220

Burleigh Heads, Burleigh Town, Burleigh Waters, Miami, Tally Valley

QLD

15.3

17.1

-1.7

10.7

10.2

+0.6

2.47

3196

Bonbeach, Chelsea, Chelsea Heights, Edithvale

VIC

19.5

-4.4

+23.9

5.2

4.5

+0.6

0.70

3199

Frankston, Frankston East, Frankston Heights, Frankston South, Karingal

VIC

14.1

11.6

+2.4

6.4

5.7

+0.7

1.11


Investor implications

The momentum map and the track-record map are different maps. Western Australia and the Northern Territory own the one-year capital growth tables, but their 10-year medians are middling to weak. Queensland is the only state that ranks highly on both horizons, which is why it dominates the balanced tables. Investors extrapolating WA's 20% to 30% medians forward should remember that the state's decade-long annualised figure is 5.6% for houses: fast years and flat stretches average out. Extreme single-year growth, particularly the near-40% figures at the top of the leader tables, warrants scepticism and requires additional due diligence before it informs any decision.

Vacancy is doing a lot of work in the current market. With half the eligible postcodes under 1% vacancy, tight rental conditions are close to the national norm rather than a point of difference. That cuts two ways: low vacancy alone is a weak differentiator when it is so widespread, but the high-vacancy tail (Section 5 and Table 7.3) is genuinely informative, because elevated vacancy now stands out against a tight national backdrop. Vacancy also edged up from roughly 0.90% to 1.00% at the median over the past quarter, a small move worth monitoring rather than acting on.

Alignment is the strongest single screen in this report. Markets appearing across the one-year tables, the 10-year tables and the balanced tables, such as the Coomera corridor and parts of Brisbane's affordable middle ring, are worth further investigation because three independent measures agree. Conversely, momentum without a track record (Section 4) and track record without momentum (Table 7.2) are both single-signal stories. Postcode level figures can also mask wide variation between localities, especially in broad rural postcodes, so suburb and asset level work remains essential. Capital growth and rental demand should be assessed together, and neither replaces professional advice on an investor's individual circumstances.

Executive summary

The year to Q1 2026 rewarded the smaller capitals and the regions. Across the 899 eligible postcode markets, median one-year capital growth reached 12.9% for houses and 11.2% for units, with the distribution skewed heavily toward Western Australia (24.8% house median, 31.1% unit median), the Northern Territory, Queensland, Tasmania and South Australia. New South Wales, Victoria and the ACT recorded single-digit medians, and ACT unit markets slipped marginally backwards. Around one in ten eligible markets recorded negative capital growth for the year, a useful reminder that a strong national median is not a universal experience.

Over ten years the ranking inverts in important ways. Queensland (8.8% annualised house median) and Tasmania (8.5%) hold the strongest long-term records, while Western Australia's decade figure of 5.6% shows its current boom is recovering lost ground, and the Northern Territory's near-flat decade urges caution about reading its current momentum as trend. Houses have out-compounded units over the decade in every state, most sharply in New South Wales and Victoria, although units out-grew houses over the past year in Queensland and Western Australia, led by affordable metropolitan unit markets such as Inala (4077) and Beenleigh (4207) in Brisbane and Bunbury (6230) in WA.

Rental conditions remain historically tight. The median eligible postcode vacancy rate for the April to June 2026 quarter is 1.00%, half of all eligible postcodes sit below 1%, and in the Northern Territory every eligible postcode does. Vacancy nonetheless drifted up from about 0.90% in the January to March quarter, and the high-vacancy tail includes growth-corridor postcodes such as Rockbank and Thornhill Park (3335, 15.2%) where supply is running ahead of tenant demand. The watchlists in Section 7 flag 16 tight-vacancy markets without price momentum, 16 strong-decade markets that have stalled, and 45 markets pairing elevated vacancy with weak recent capital growth, of which the 20 highest-vacancy are tabled.

The quarter's clearest signal is alignment. A relatively small set of markets, concentrated in south east Queensland's growth corridors and Brisbane's affordable middle ring, combine positive recent capital growth, a top-tier 10-year record, tight vacancy and genuine market depth. Those markets top the balanced tables in Section 6 and are worth further investigation. Everything else in the leader tables carries at least one caveat, whether a missing track record, a thin market just above the depth guardrail, a broad rural postcode or extreme single-year growth, and requires additional due diligence before any capital decision.


Methodology and data guardrails

Data inputs. Four datasets were supplied for this quarter: (1) raw one-year capital growth per postcode and property type comparing Q1 2026 with Q1 2025, including settled-sales counts for both quarters; (2) 10-year annualised capital growth per postcode and property type (2015 to 2025); (3) monthly postcode level vacancy data (listings, dwellings and vacancy rate); and (4) the public Australian postcodes reference used to attach localities and states. Postcodes were standardised to integers, property types to House and Unit, and vacancy converted to a percentage.

Vacancy period. The vacancy file supplied covers the three months April to June 2026; each postcode's vacancy rate in this report is the simple average of those three monthly rates. The prior quarter's file (January to March 2026, median 0.90% across the same postcodes) was retained as a reference point for the quarter-on-quarter comparison noted in the commentary but is not otherwise used in the tables. Vacancy is postcode level only and is not split by property type.

Market-depth guardrail (30 settled sales). Only postcode markets with at least 30 settled sales in both quarters (Q1 2025 and Q1 2026) are retained; the binding constraint is the thinner quarter, reported in the tables as Min Qtr Sales. This depth rule substitutes for a minimum-dwellings rule: no dwelling-count field is supplied with the growth data, and settled-sales counts are a stronger, direct measure of transaction depth than dwelling stock in any case. The guardrail removed 2,276 of 3,190 raw postcode markets, leaving 914; one further market was dropped because it had no matching 10-year history.

Extreme-growth cap (40%). Nine postcodes recorded one-year capital growth above 40% in at least one property type: 2021, 3020, 4114, 4225, 4802, 6014, 6100, 6101 and 6163. All rows for those postcodes (14 markets) were excluded from the headline rankings, every table and every chart. Growth at that pace within a single year is more often a symptom of compositional change or a thin prior base than of underlying appreciation, and including it would distort the leader tables. The remaining 899 markets across 728 postcodes form the eligible universe.

Watchlist thresholds (this quarter's values). Computed on the eligible universe: tight vacancy is the 25th percentile, 0.68%; high vacancy is the 75th percentile, 1.53%; a strong long-term record is the 75th percentile of 10-year annualised capital growth, 8.1%; weak recent momentum is a fixed threshold of one-year capital growth at or below 2.0%. The balanced-score pool additionally requires vacancy at or below the national median of 1.00%, and 415 markets qualified.

Locality cleaning. From the postcodes reference, rows typed Post Office Boxes or LVR were dropped. Locality names containing (as whole words) DC, BC, PO, MALL, PLAZA, CENTRE or SHOPPING, or the phrases POST OFFICE, BUSINESS CENTRE or DELIVERY CENTRE, were treated as non-residential and removed; whole-word matching ensures genuine names such as Mallacoota are untouched. Names were then smart title-cased (including Mc and O' prefixes), de-duplicated case-insensitively, and up to five key localities retained per postcode in the reference's own order. Each postcode's state is the most common state in the reference, with a postcode-range fallback where a postcode is absent.

Data attributions. The supplied growth datasets carry the following required acknowledgements. New South Wales: contains property sales information provided under licence from the Valuer General New South Wales; SQM Research Pty Ltd is authorised as a Property Sales Information Provider by the Valuer General of New South Wales. Queensland: © State of Queensland (Department of Resources) 2024; the State gives no warranty in relation to the data (including accuracy, reliability, completeness, currency or suitability) and accepts no liability (including without limitation, liability in negligence) for any loss, damage or costs (including consequential damage) relating to any use of the data; data must not be used for direct marketing or be used in breach of the privacy laws.
Disclaimer: To give this report credibility, postcode markets with fewer than 30 settled sales in a quarter have been excluded, so that every figure reflects a market with genuine transaction depth rather than a small number of isolated sales. Postcodes recording one-year growth above 40% were also held out of the headline rankings, to keep extreme single-year movements from distorting the leader tables. This report is general information only and does not constitute financial, legal, taxation, credit, investment or superannuation advice. It does not take account of any individual's circumstances or objectives, and the market data should be used only as a starting point for further due diligence. Investors should seek advice from appropriately qualified professionals before making any investment decision. Figures are derived solely from the supplied datasets for the stated periods and are subject to the data limitations described in the methodology. Past performance is not a reliable indicator of future performance.

Why Buy With Aus Investment Properties?

  • Dedicated In-house Project Manager.
  • High-yielding properties.
  • Independent rental assessment.
  • Full turnkey properties, 'Ready to Rent'.
  • Brand new properties with builders warranty.
  • High quality, highly specified properties.
  • Tax and depreciation benefits from new properties.
  • Buy direct from the builder.
  • Investor or SMSF.
Buy Property Banner

Capital Growth 12 months, measures the increase in a property’s value over the previous 12 months, indicating how much the investment has appreciated in that timeframe.

Capital Growth 10-year annualised, reflects the average annual increase in a property’s value over the last decade, smoothing out short-term fluctuations to show long-term appreciation trends.

Vacancy Rate, indicates the percentage of properties that are currently unoccupied in that postcode, It’s a key indicator for investors to assess the rental demand.

SMSF Property Investing, when investing inside your SMSF there are some restrictions on how you can purchase investment properties. We use the following information to help navigate the SMSF investment property options.

This property is a single-contract property suitable for an SMSF.

SMSF Single Contract

Compare listings

Compare