General market information for residential property investors
Reporting period: Q1 2026
1. TLDR This quarter reads as a growth-led market with broad rental tightness underneath it. Across the postcode markets with sufficient sales depth, capital growth was the dominant signal, while vacancy was extremely tight almost everywhere, so the two signals are pointing the same way in many markets, but for different reasons.
- Capital growth led the quarter. Median 1-year growth across eligible postcode markets was 12.6%, with only 10.6% of markets recording a fall. Median 10-year annualised growth was 6.4%.
- Rental markets are tight nationwide. The median vacancy rate was 0.86%, and 62.5% of markets sat under 1%. This suggests rental-market pressure is widespread rather than isolated to a few areas.
- Houses are the stronger property-type signal. Houses led units on capital growth over both horizons, with median capital growth of 12.9% versus 11.2% over one year, and a wider gap over ten years (annualised capital growth of 7.1% versus 3.6%).
- Western Australia, the Northern Territory and Queensland led recent capital-growth momentum. WA recorded the strongest median 1-year capital growth (houses 24.8%, units 31.1%), ahead of the NT and Queensland. New South Wales, Victoria and the ACT were noticeably softer on recent capital growth.
- Queensland, Tasmania and South Australia show the steadiest long-term capital-growth records. On 10-year annualised capital growth, Queensland (8.8%), Tasmania (8.4%) and SA (8.0%) led for houses, while the NT was weakest long term despite strong recent capital-growth figures.
- Main takeaway: the strongest markets for further investigation are those where recent capital-growth momentum, a longer-term capital-growth track record and tight vacancy line up together, most visibly across parts of Queensland. A high capital-growth figure on its own should not be treated as a standalone buy signal.
Introduction
This is the quarterly postcode-level property market report prepared for Aus Investment Properties. It is designed to help residential property investors identify postcode markets worth closer attention, whether the interest is in high-yielding holdings, new turnkey investment property, SMSF-suitable opportunities or off-market options.
The report combines three measures for each postcode market: 1-year capital growth (a measure of recent momentum), 10-year annualised capital growth (a measure of longer-term performance), and the vacancy rate (used here as a rental-demand indicator). Reading these together gives a more balanced view than any single number, because capital growth and rental demand should be assessed together rather than in isolation.
The purpose is to surface postcode markets showing stronger capital growth, tighter rental conditions, or both, and to flag where the signals are mixed or where extreme figures warrant caution. It is intended as a starting point for investor due diligence, not as a list of recommendations.
National market snapshot
The charts below summarise how the states and territories compare on recent growth, long-term growth and rental tightness. Vacancy is reported at the postcode level (it is not split by houses and units), so the vacancy chart is a single series per state.
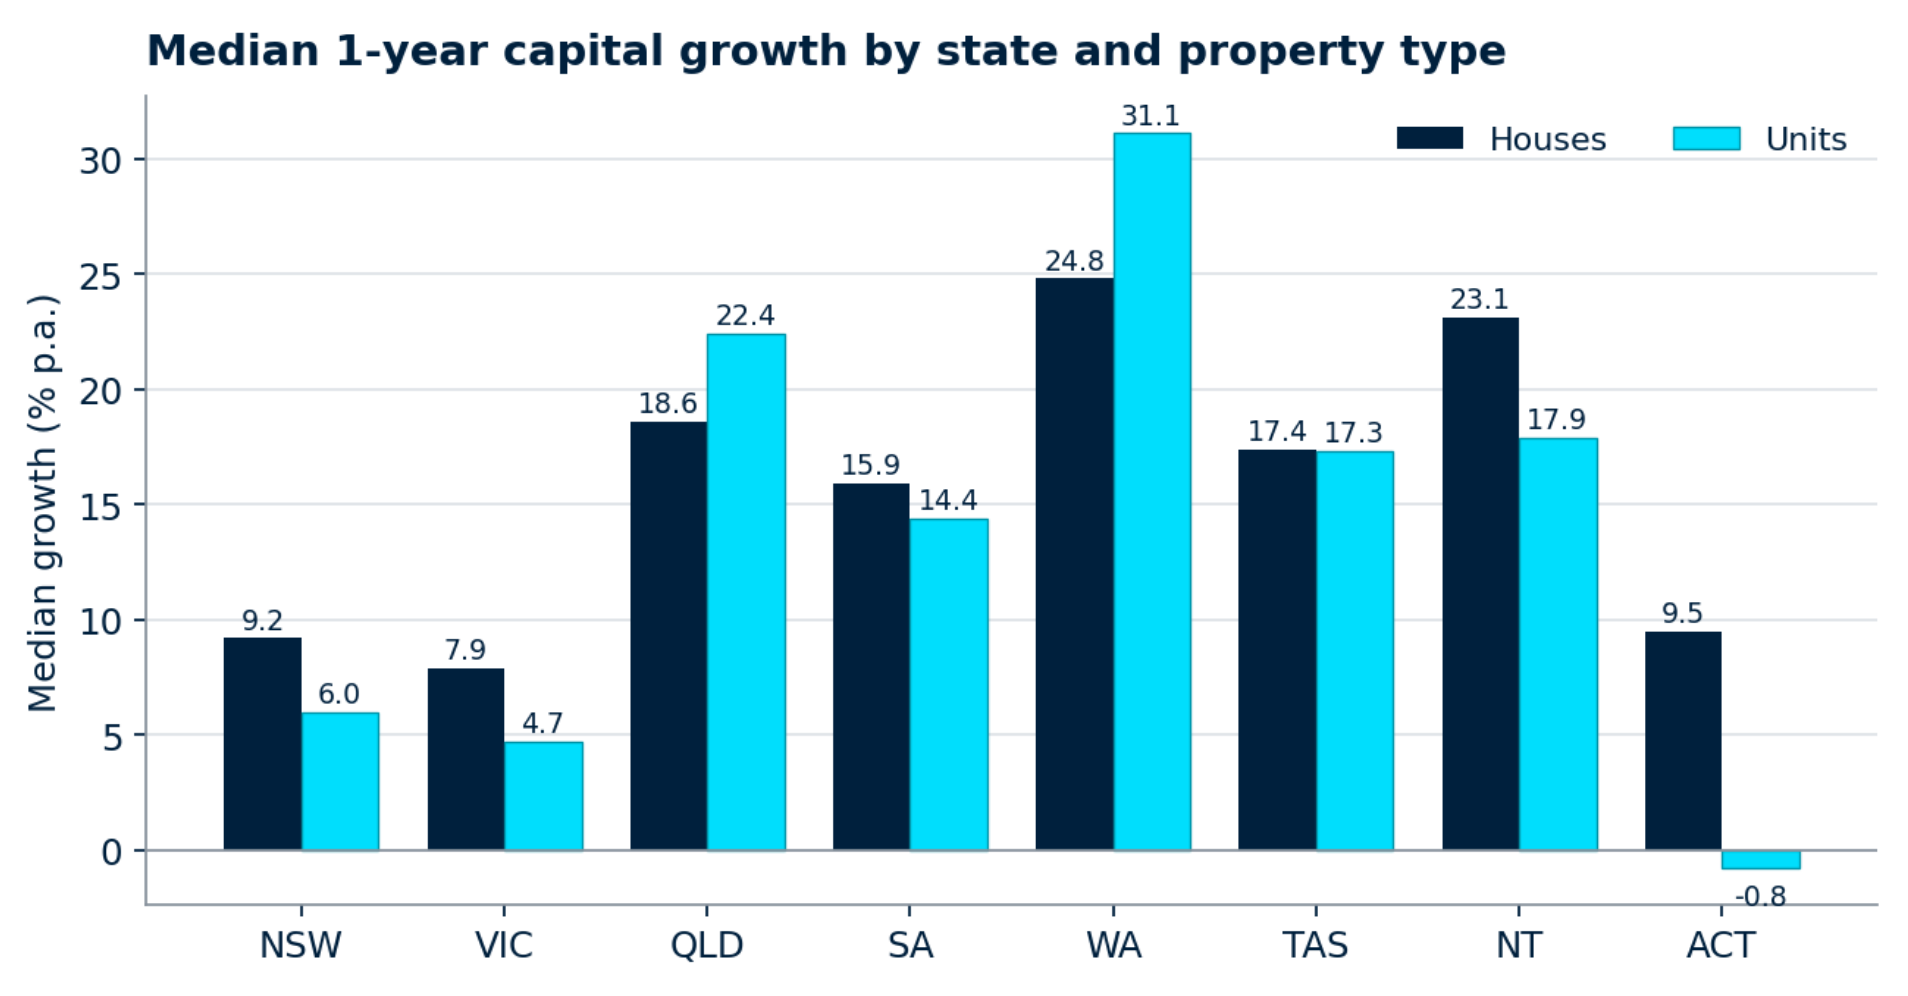 Median 1-year capital growth by state and property type (eligible postcode markets).
Recent momentum is concentrated in the west and north. Western Australia points to the strongest recent momentum, with median 1-year growth of 24.8% for houses and 31.1% for units, the only market where unit momentum clearly outran houses. The Northern Territory (houses 23.1%), Queensland (units 22.4%, houses 18.6%), Tasmania and South Australia also recorded double-digit medians. New South Wales (houses 9.2%, units 6.0%) and Victoria (7.9% and 4.7%) were materially softer, and ACT units were the weakest reading on the board at -0.8%.
_1782096924q18Ro.png)
Median 10-year annualised growth by state and property type (eligible postcode markets).
The long-term picture reorders the table. On 10-year annualised growth, Queensland (8.8% houses), Tasmania (8.4%) and South Australia (8.0%) show the most consistent records, with New South Wales houses at 7.0%. Western Australia is the clearest divergence: despite leading recent momentum, its 10-year house figure of 5.6% sits mid-pack, which points to a recent surge on a shorter track record rather than a long, steady run. The Northern Territory is weakest long term (1.2% for houses), so its strong 1-year reading should be treated with particular caution. Across almost every state, houses out-performed units over the longer horizon, the unit gap is widest in markets where recent unit momentum has been driven by shorter-term factors.
_1782097031dqcMU.png) Median vacancy rate by state (postcode-level).
Median vacancy rate by state (postcode-level).
_1782097129PYek4.png)
Median vacancy rate by state (postcode-level).Share of postcode markets sitting under 1% vacancy, by state.
Rental conditions are tight across the board, with differences of degree rather than direction. Tasmania (0.4%), the Northern Territory (0.45%) and Western Australia (0.52%) recorded the tightest median vacancy, and in the NT and Tasmania virtually every market sat under 1% (100.0% and 93.3% of markets respectively). Western Australia was close behind at 90.5%. New South Wales and Victoria were the loosest of the group, yet still tight in absolute terms, with median vacancy near 0.96% and around half of their markets under 1%. In short, low vacancy suggests rental-market pressure is a national feature this quarter, which makes the growth differences between states the more useful point of separation.
Where signals are mixed: Western Australia and the NT pair strong momentum and tight vacancy with thinner long-term records; New South Wales and Victoria pair steadier long-term growth and (relatively) looser vacancy with soft recent momentum; Queensland is the market where recent growth, long-term growth and rental tightness most often line up together.
Capital growth leaders
The tables below rank the strongest postcode markets on recent and long-term growth, separately for houses and units. Two cautions apply throughout. First, strong 1-year growth points to recent momentum but should not be treated as a standalone buy signal, momentum can fade, and a single strong year says little about durability. Second, several of the highest 1-year readings sit in broad regional or rural postcodes that cover large areas; these can be more volatile and require additional due diligence even where they clear the market-depth guardrail.


_1776213150EC5td.jpg)
-(1)_17762144417K00n.png)
_1776214724iUydB.png)