 By Aus Investment Properties

Australian Residential Property: Q2 2026
Postcode level capital growth, long term performance and vacancy analysis
Reporting Period: Q2 2026 (capital growth Q2 2025 vs Q2 2026, vacancy April to June 2026)
Report Summary
Australia's postcode level residential markets recorded another year of solid capital growth to Q2 2026, with the strength again concentrated outside the two largest capitals. Across the 984 postcode markets that passed our market-depth guardrail (at least 30 settled sales in both quarters), the median house market recorded 13.0% capital growth over the year and the median unit market 10.7% capital growth. Western Australia, Queensland and the Northern Territory carried the momentum, while Sydney, Melbourne and Canberra grew at a much more modest pace. Rental markets remain tight: the median vacancy rate across eligible markets is 0.99% and just over half of eligible postcodes sit under 1%. As always, a strong growth figure on its own should not be treated as a standalone buy signal: capital growth and rental demand should be assessed together.
- Capital growth: the median eligible house market posted 13.0% one-year capital growth (12.9% last quarter) and the median unit market 10.7% (11.2% last quarter); 115 eligible markets, about 12%, went backwards, so the national medians conceal genuine dispersion.
- Vacancy: the median vacancy rate across eligible markets is 0.99% (April to June 2026 average), in line with the 1.00% reported for the same period in our previous edition and up from about 0.90% in January to March 2026, and 51% of eligible postcodes sit under 1%, which suggests rental-market pressure remains widespread.
- Houses versus units: houses lead on capital growth nationally over both horizons (median 10-year annualised capital growth of 7.0% for houses versus 3.4% for units), but units out-grew houses over the past year in Queensland, Western Australia and South Australia.
- Recent momentum leaders: the strongest eligible one-year capital growth markets include the broad Far North Queensland postcode 4871 (38.1% capital growth for houses), Perth's Joondalup corridor (6027, 37.9% for houses) and Airlie Beach units (4802, 39.9%, just under the 40% cap), figures that warrant scepticism and require additional due diligence.
- Long-term leaders: south east Queensland again dominates the 10-year annualised capital growth tables, led by the Moreton Bay islands (4184, 19.5% annualised) and the Coomera to Pimpama corridor (4209, 15.0% annualised), both of which also posted strong recent capital growth and are worth further investigation.
- Main takeaway: the markets that combine positive recent capital growth, a solid 10-year capital growth track record and tight vacancy remain concentrated in Queensland, with Western Australia, Tasmania and South Australia also represented; the balanced tables in Section 6 are the best screening starting point, not a shortlist of recommendations.
Introduction
This report is the quarterly postcode level review of Australian residential investment markets prepared by Aus Investment Properties. Its purpose is to give investors a disciplined, data-driven view of where capital growth and rental demand currently sit, and to do so with guardrails that strip out statistically thin or extreme results before they can mislead.
Three measures are used throughout. One-year capital growth (Q2 2025 to Q2 2026, comparing April to June 2026 with April to June 2025) captures recent momentum. Ten-year annualised capital growth (2015 to 2025) captures the long-term track record and smooths out single-cycle noise. The vacancy rate (the April to June 2026 monthly average for each postcode) is our indicator of rental demand: a low vacancy rate suggests rental-market pressure, while an elevated one points to softer tenant demand or new supply. No single measure is sufficient on its own; capital growth and rental demand should be assessed together.
All figures are postcode level. A postcode can span several suburbs with quite different characteristics, so nothing in this report should be read as suburb level analysis. Vacancy is also postcode level only and is not split by houses and units. Growth percentages throughout this report are capital growth figures, not rental yields.
National market snapshot
The four charts below summarise the eligible universe: the 984 postcode markets (793 postcodes; 692 house markets and 292 unit markets) that passed the 30-settled-sales depth guardrail in both quarters and were not removed by the 40% extreme-growth cap. The two vacancy charts cover 791 of those postcodes: two postcodes whose vacancy data averages fewer than 100 dwellings are left out of all vacancy measures.
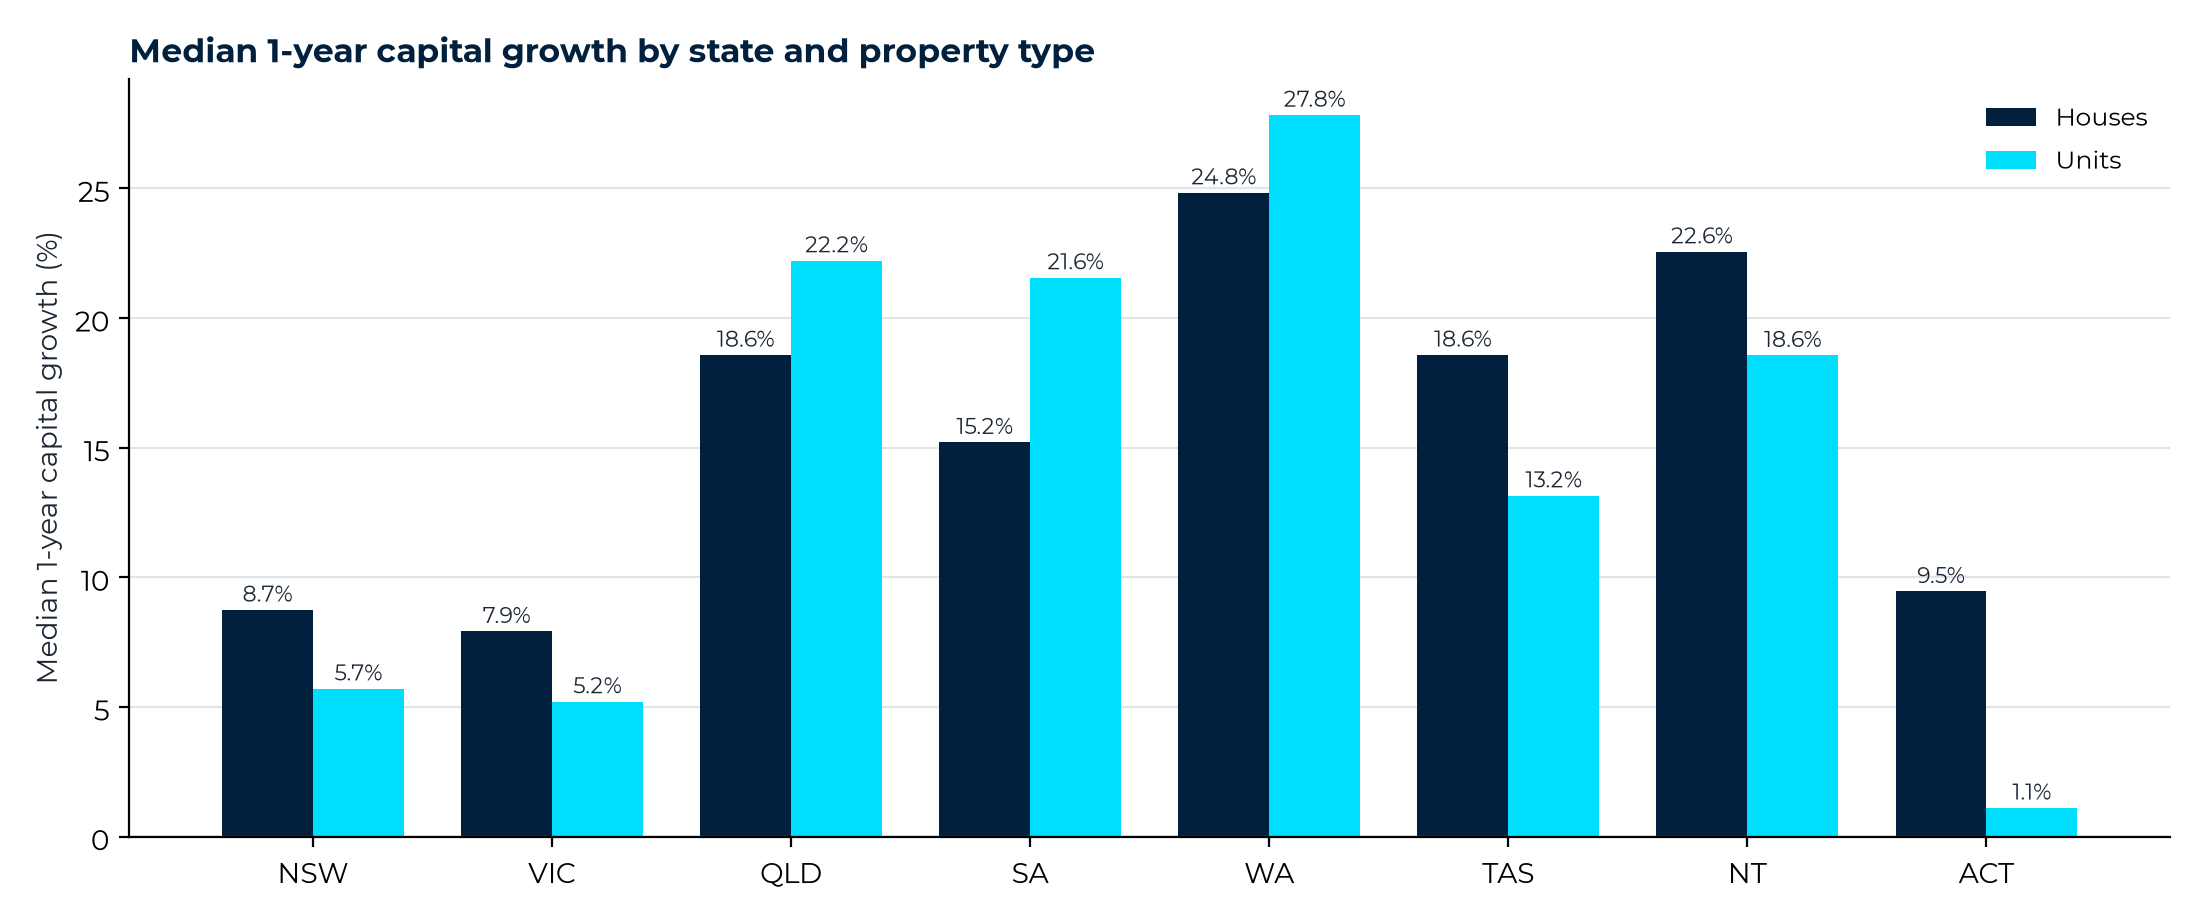
Median 1-year capital growth (Q2 2025 to Q2 2026) by state and property type, eligible postcode markets. Houses in navy, units in aqua.
Western Australia again leads the nation, with median capital growth of 24.8% for house markets and 27.8% for unit markets, followed by the Northern Territory (22.6% houses) and Queensland (18.6% houses, 22.2% units). Tasmania (18.6% houses) and South Australia (15.2% houses) also posted strong medians, although their unit medians rest on very few eligible markets (one in Tasmania and two in South Australia) and should be read with care. By contrast, New South Wales (8.8% houses, 5.7% units), Victoria (7.9% houses, 5.2% units) and the ACT (9.5% houses, 1.1% units) grew at well under half the pace of the leaders. Medians above 20% in any state deserve a sceptical read: growth at that pace is rarely sustained, and some of it reflects smaller capital city and regional markets catching up from a lower base.
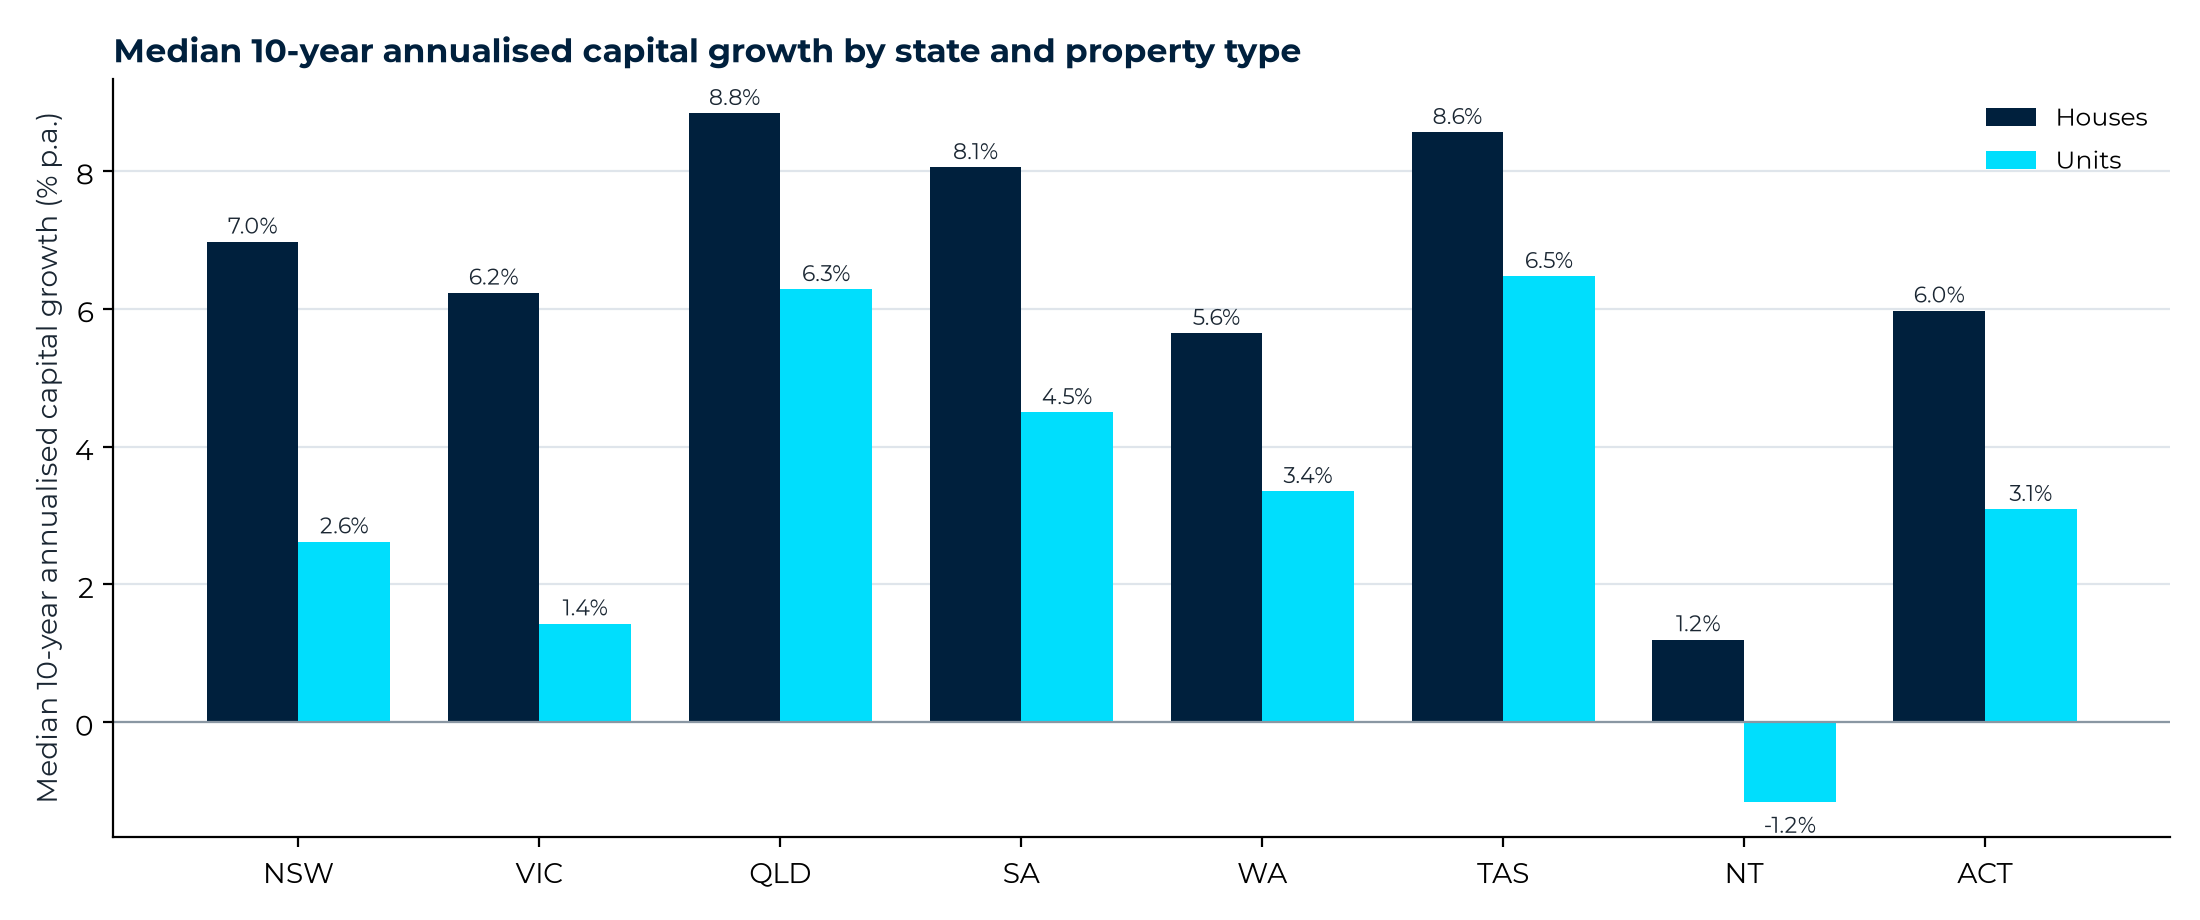
Median 10-year annualised capital growth (2015 to 2025) by state and property type, eligible postcode markets. Houses in navy, units in aqua.
The 10-year view reorders the field. Queensland (8.8% houses) and Tasmania (8.6% houses) hold the strongest long-term medians, with South Australia close behind (8.1%), while Western Australia's long-term house median of 5.6% is middling despite its current momentum: a reminder that WA's present surge follows a long flat stretch. The Northern Territory's 10-year medians (1.2% houses, -1.2% units) show that today's strong NT momentum sits on a weak decade, so NT figures in the leader tables warrant extra due diligence. Nationally, houses have out-compounded units over the decade in every state.
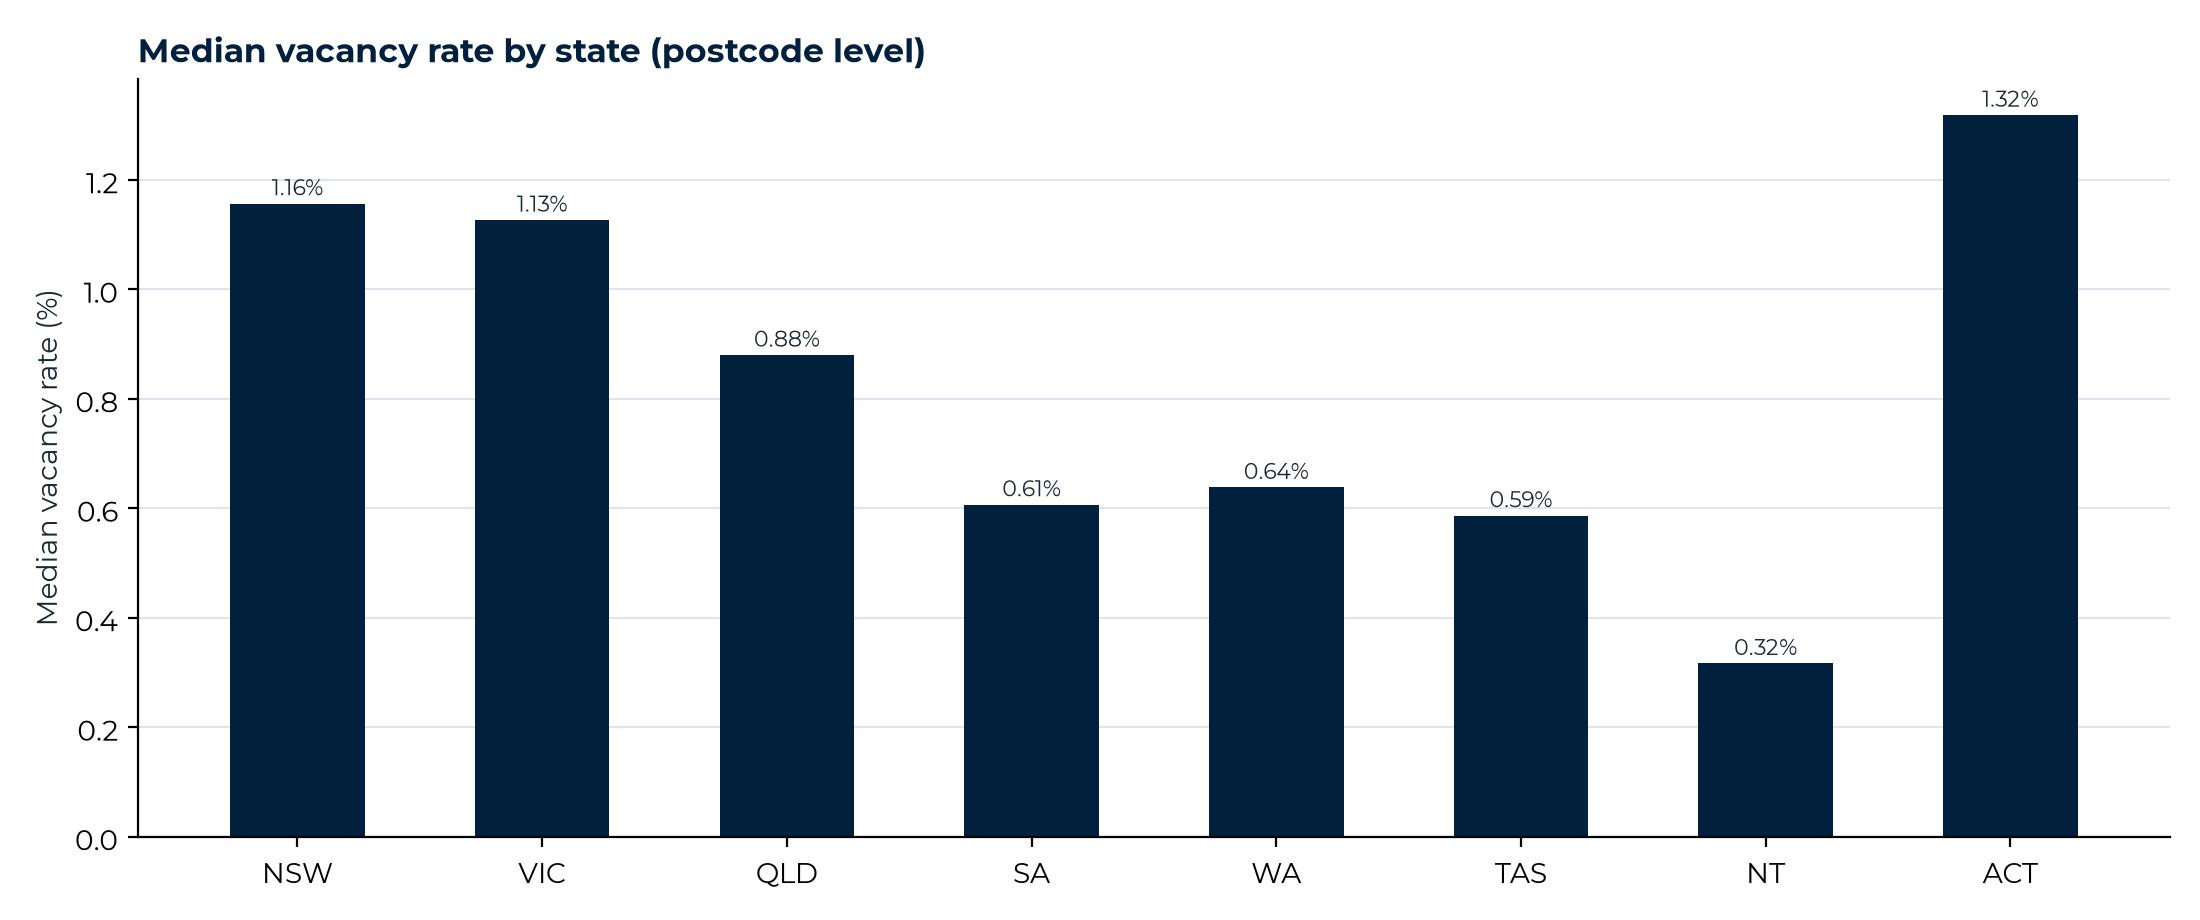
Median vacancy rate by state, postcode level (April to June 2026 monthly average). Vacancy is a single postcode level series, not split by property type.
Vacancy remains tight in most states. The Northern Territory (0.32%), Tasmania (0.59%), South Australia (0.61%), Western Australia (0.64%) and Queensland (0.88%) have median postcode vacancy under 1%, while Victoria (1.13%), New South Wales (1.16%) and the ACT (1.32%) sit modestly above it. Note that vacancy is postcode level and a single series per postcode; it cannot distinguish house and unit rental conditions.
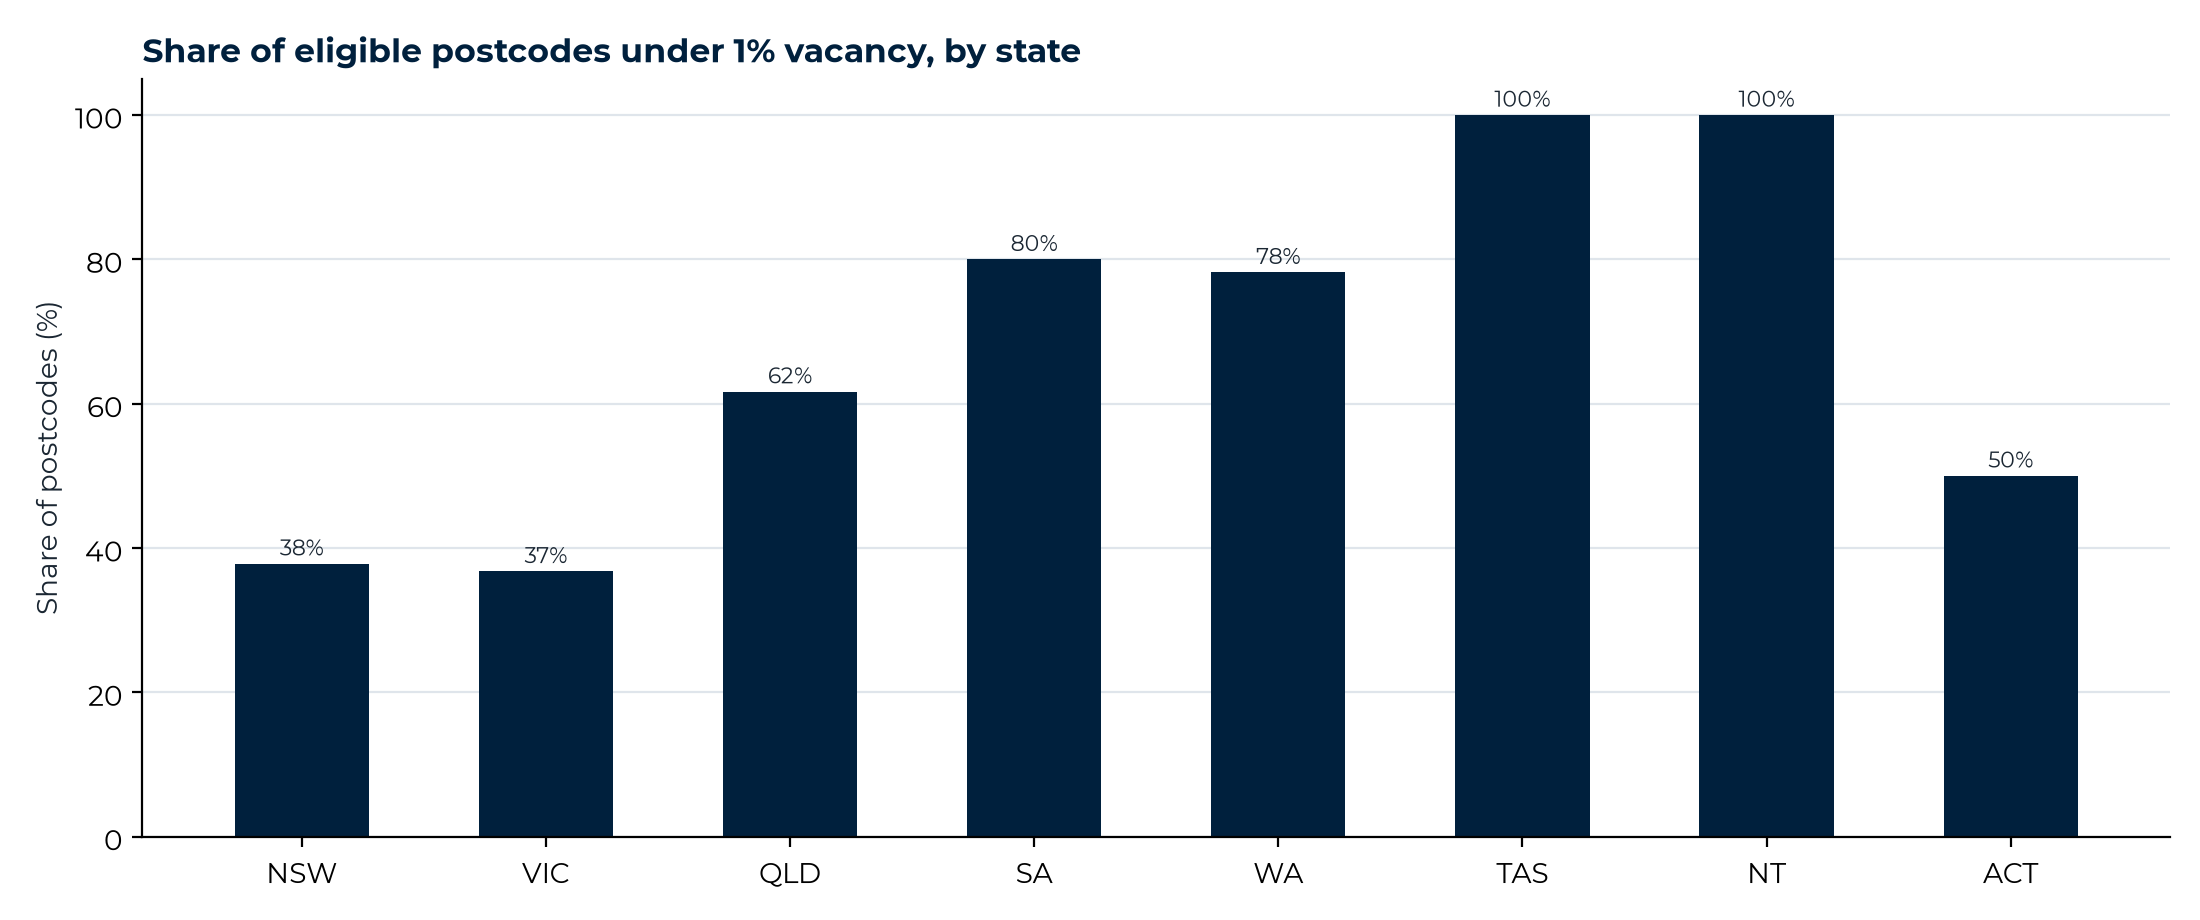
Share of eligible postcode markets with an average vacancy rate below 1%, by state (April to June 2026).
The share of postcodes under 1% vacancy makes the same point more starkly: every eligible postcode in the Northern Territory and Tasmania, 80% of South Australian postcodes, 78% of WA postcodes and 62% of Queensland postcodes are below 1%, against 50% in the ACT, 38% in New South Wales and 37% in Victoria. Tight vacancy across so much of the country suggests rental-market pressure will remain a feature of the investment landscape, particularly outside the two largest capitals.
Capital growth leaders
The four tables below rank the top 20 eligible markets by one-year and 10-year annualised capital growth, for houses and units separately. Where a postcode appears in both the one-year and 10-year tables (for example postcode 4184 on the Moreton Bay islands and 4553 in the Mooloolah Valley for houses, or 4207 Beenleigh and 4301 Redbank Plains for units), recent momentum is backed by a long-term track record, which is worth further investigation. Where a market shows strong recent capital growth but a flat decade (for example postcode 3039 Moonee Ponds units, 37.9% over the year against 0.8% annualised over ten years, or 6005 West Perth units, 35.6% against 1.1%), the momentum has no track record behind it and requires additional due diligence. Several of the strongest one-year figures also sit in broad rural or regional postcodes, such as 4871 in Far North Queensland and 2360 around Inverell, where conditions vary widely across localities; these should not be treated as a standalone buy signal. Min Qtr Sales, the lower of the two quarterly settled-sales counts, is shown as the market-depth indicator: a higher figure means stronger market depth behind the growth estimate.
Table 4.1: Top 20 house markets by 1-year capital growth
| Postcode | Key Localities | State | Property Type | 1 Year Growth % | 10 Yr Annualized Growth % | Vacancy Rate % | Min Qtr Sales |
|---|---|---|---|---|---|---|---|
| 4871 | Almaden, Aloomba, Aurukun, Basilisk, Bellenden Ker | QLD | House | 38.1 | 4.2 | 0.67 | 33 |
| 6027 | Beldon, Connolly, Edgewater, Heathridge, Joondalup | WA | House | 37.9 | 5.2 | 0.72 | 124 |
| 2360 | Auburn Vale, Bukkulla, Cherry Tree Hill, Copeton, Elsmore | NSW | House | 36.8 | 5.4 | 0.24 | 59 |
| 4800 | Andromache, Brandy Creek, Breadalbane, Cannon Valley, Cape Conway | QLD | House | 36.1 | 9.1 | 1.15 | 61 |
| 6110 | Gosnells, Huntingdale, Martin, Southern River | WA | House | 36.1 | 5.9 | 0.53 | 111 |
| 4184 | Coochiemudlo Island, Karragarra Island, Lamb Island, Macleay Island, Peel Island | QLD | House | 35.9 | 19.5 | 4.24 | 138 |
| 6028 | Burns Beach, Currambine, Iluka, Kinross | WA | House | 35.7 | 5.8 | 0.95 | 68 |
| 6060 | Dog Swamp, Joondanna, Tuart Hill, Yokine, Yokine South | WA | House | 35.0 | 4.4 | 0.30 | 46 |
| 6109 | Maddington, Orange Grove | WA | House | 34.7 | 6.2 | 0.67 | 36 |
| 6024 | Greenwood, Warwick | WA | House | 34.6 | 4.8 | 0.49 | 36 |
| 7248 | Alanvale, Inveresk, Invermay, Mayfield, Mowbray | TAS | House | 34.1 | 8.7 | 0.65 | 51 |
| 3825 | Aberfeldy, Amor, Caringal, Coalville, Coopers Creek | VIC | House | 33.7 | 8.8 | 2.10 | 55 |
| 6064 | Alexander Heights, Girrawheen, Koondoola, Marangaroo | WA | House | 33.2 | 4.9 | 0.36 | 83 |
| 4113 | Eight Mile Plains, Fruitgrove, Runcorn | QLD | House | 32.5 | 8.2 | 0.94 | 54 |
| 4553 | Diamond Valley, Glenview, Mooloolah, Mooloolah Valley, Palmview | QLD | House | 32.4 | 12.1 | 0.86 | 68 |
| 3672 | Benalla, Benalla West | VIC | House | 32.0 | 7.0 | 2.70 | 58 |
| 6111 | Canning Mills, Champion Lakes, Karragullen, Kelmscott, Roleystone | WA | House | 32.0 | 5.1 | 0.73 | 74 |
| 5038 | Camden Park, Plympton, Plympton Park, South Plympton | SA | House | 31.7 | 8.1 | 0.40 | 48 |
| 6104 | Ascot, Belmont, Redcliffe | WA | House | 31.5 | 4.4 | 0.25 | 34 |
| 6108 | Thornlie | WA | House | 31.4 | 5.2 | 0.36 | 63 |
Table 4.2: Top 20 unit markets by 1-year capital growth
| Postcode | Key Localities | State | Property Type | 1 Year Growth % | 10 Yr Annualized Growth % | Vacancy Rate % | Min Qtr Sales |
|---|---|---|---|---|---|---|---|
| 4802 | Airlie Beach, Cannonvale, Flametree, Jubilee Pocket, Mandalay | QLD | Unit | 39.9 | 4.8 | 0.99 | 55 |
| 3039 | Moonee Ponds | VIC | Unit | 37.9 | 0.8 | 0.83 | 42 |
| 4510 | Balingool, Beachmere, Bellmere, Caboolture, Caboolture South | QLD | Unit | 36.9 | 8.1 | 0.84 | 46 |
| 4305 | Basin Pocket, Brassall, Brassall Heights, Bremer, Churchill | QLD | Unit | 36.5 | 7.3 | 0.61 | 43 |
| 6005 | Kings Park, West Perth | WA | Unit | 35.6 | 1.1 | 1.20 | 40 |
| 4350 | Wellcamp, Westbrook, Wilsonton, Athol, Blue Mountain Heights | QLD | Unit | 34.4 | 5.5 | 0.60 | 151 |
| 4007 | Ascot, Brisbane Airport, Doomben, Hamilton, Hamilton Central | QLD | Unit | 34.1 | 3.7 | 0.68 | 113 |
| 6056 | Baskerville, Bellevue, Boya, Greenmount, Helena Valley | WA | Unit | 34.0 | 4.7 | 0.44 | 40 |
| 6004 | East Perth | WA | Unit | 34.0 | 1.9 | 0.96 | 64 |
| 2034 | Coogee, South Coogee | NSW | Unit | 33.1 | 5.4 | 2.13 | 49 |
| 6100 | Burswood, Lathlain, Victoria Park | WA | Unit | 33.1 | 2.7 | 0.64 | 35 |
| 6103 | Rivervale | WA | Unit | 32.3 | 2.7 | 0.74 | 58 |
| 6210 | Clifton, Barragup, Bouvard, Coodanup, Dawesville | WA | Unit | 31.3 | 5.7 | 1.40 | 60 |
| 6000 | Perth, Perth Gpo | WA | Unit | 31.1 | 2.0 | 1.00 | 102 |
| 5045 | Glenelg, Glenelg East, Glenelg Jetty Road, Glenelg North, Glenelg South | SA | Unit | 31.0 | 5.6 | 1.22 | 43 |
| 6168 | Cooloongup, East Rockingham, Garden Island, Hillman, Peron | WA | Unit | 30.9 | 6.9 | 0.55 | 38 |
| 4207 | Alberton, Bahrs Scrub, Bannockburn, Beenleigh, Belivah | QLD | Unit | 30.8 | 9.9 | 0.68 | 95 |
| 4171 | Balmoral, Bulimba, Galloways Hill, Hawthorne | QLD | Unit | 30.7 | 4.7 | 0.93 | 44 |
| 4301 | Collingwood Park, Greenwood Village, Redbank, Redbank Plains | QLD | Unit | 30.5 | 9.6 | 0.86 | 42 |
| 4066 | Auchenflower, Mount Coot-Tha, Stuartholme, Toowong, Torwood | QLD | Unit | 29.6 | 5.1 | 1.01 | 79 |
Table 4.3: Top 20 house markets by 10-year annualised capital growth
| Postcode | Key Localities | State | Property Type | 1 Year Growth % | 10 Yr Annualized Growth % | Vacancy Rate % | Min Qtr Sales |
|---|---|---|---|---|---|---|---|
| 4184 | Coochiemudlo Island, Karragarra Island, Lamb Island, Macleay Island, Peel Island | QLD | House | 35.9 | 19.5 | 4.24 | 138 |
| 2295 | Fern Bay, Stockton | NSW | House | 0.9 | 15.5 | 0.46 | 33 |
| 4209 | Canowindra, Coomera, Pimpama, Upper Coomera, Willow Vale | QLD | House | 22.8 | 15.0 | 0.46 | 207 |
| 2265 | Cooranbong, Martinsville | NSW | House | 11.1 | 14.9 | 3.16 | 33 |
| 2487 | Casuarina, Chinderah, Cudgen, Duranbah, Fingal Head | NSW | House | 8.7 | 14.3 | 2.03 | 39 |
| 3809 | Officer, Officer South | VIC | House | -1.7 | 12.8 | 1.50 | 111 |
| 5113 | Davoren Park, Davoren Park North, Davoren Park South, Elizabeth Downs, Elizabeth North | SA | House | 18.2 | 12.5 | 0.84 | 96 |
| 4280 | Jimboomba, Maclean, North Maclean, South Maclean, Stockleigh | QLD | House | 4.7 | 12.4 | 3.07 | 114 |
| 4553 | Diamond Valley, Glenview, Mooloolah, Mooloolah Valley, Palmview | QLD | House | 32.4 | 12.1 | 0.86 | 68 |
| 2179 | Austral, Leppington | NSW | House | 13.0 | 12.0 | 4.82 | 100 |
| 4573 | Coolum Beach, Marcus Beach, Mount Coolum, Peregian Beach, Peregian Beach South | QLD | House | 8.6 | 11.9 | 0.97 | 110 |
| 4306 | Blackbutt North, Blackbutt South, Blacksoil, Blackwall, Borallon | QLD | House | 21.9 | 11.8 | 1.30 | 235 |
| 4567 | Castaways Beach, Little Cove, Noosa Heads, Sunrise Beach, Sunshine Beach | QLD | House | -8.5 | 11.8 | 4.34 | 47 |
| 4519 | Beerwah, Coochin Creek, Crohamhurst, Peachester | QLD | House | 22.2 | 11.7 | 0.48 | 38 |
| 4207 | Alberton, Bahrs Scrub, Bannockburn, Beenleigh, Belivah | QLD | House | 22.6 | 11.7 | 0.68 | 284 |
| 4018 | Fitzgibbon, Taigum | QLD | House | 29.4 | 11.6 | 0.27 | 30 |
| 2557 | Catherine Field, Rossmore, Gregory Hills, Gledswood Hills | NSW | House | 13.8 | 11.5 | 1.32 | 84 |
| 2321 | Berry Park, Butterwick, Clarence Town, Cliftleigh, Duckenfield | NSW | House | 10.6 | 11.4 | 1.98 | 93 |
| 4615 | Barker Creek Flat, Brooklands, Bullcamp, East Nanango, Elgin Vale | QLD | House | 9.6 | 11.4 | 0.40 | 36 |
| 5112 | Elizabeth, Elizabeth East, Elizabeth Grove, Elizabeth South, Elizabeth Vale | SA | House | 11.9 | 11.3 | 0.82 | 75 |
Table 4.4: Top 20 unit markets by 10-year annualised capital growth
| Postcode | Key Localities | State | Property Type | 1 Year Growth % | 10 Yr Annualized Growth % | Vacancy Rate % | Min Qtr Sales |
|---|---|---|---|---|---|---|---|
| 4567 | Castaways Beach, Little Cove, Noosa Heads, Sunrise Beach, Sunshine Beach | QLD | Unit | 27.2 | 11.2 | 4.34 | 66 |
| 4221 | Elanora, Palm Beach | QLD | Unit | 12.7 | 10.9 | 1.63 | 90 |
| 4224 | Tugun, Tugun Heights | QLD | Unit | 29.3 | 10.8 | 1.33 | 33 |
| 4220 | Burleigh Heads, Burleigh Town, Burleigh Waters, Miami, Tally Valley | QLD | Unit | 17.1 | 10.2 | 2.47 | 107 |
| 4207 | Alberton, Bahrs Scrub, Bannockburn, Beenleigh, Belivah | QLD | Unit | 30.8 | 9.9 | 0.68 | 95 |
| 2486 | Banora Point, Bilambil, Bilambil Heights, Bungalora, Carool | NSW | Unit | 8.0 | 9.7 | 0.60 | 68 |
| 4301 | Collingwood Park, Greenwood Village, Redbank, Redbank Plains | QLD | Unit | 30.5 | 9.6 | 0.86 | 42 |
| 4214 | Arundel, Ashmore, Ashmore City, Molendinar, Parkwood | QLD | Unit | 11.5 | 9.5 | 1.10 | 57 |
| 2485 | Tweed Heads, Tweed Heads West | NSW | Unit | 18.1 | 9.4 | 0.60 | 78 |
| 4223 | Currumbin, Currumbin Valley, Currumbin Waters | QLD | Unit | 15.5 | 9.4 | 1.81 | 35 |
| 4573 | Coolum Beach, Marcus Beach, Mount Coolum, Peregian Beach, Peregian Beach South | QLD | Unit | 14.9 | 9.4 | 0.97 | 77 |
| 4566 | Munna Point, Noosaville | QLD | Unit | 2.3 | 9.2 | 2.91 | 48 |
| 4218 | Broadbeach, Broadbeach Waters, Cypress Gardens, Florida Gardens, Mermaid Beach | QLD | Unit | 9.6 | 9.0 | 3.39 | 212 |
| 4564 | Marcoola, Mudjimba, Pacific Paradise, Twin Waters | QLD | Unit | 16.7 | 9.0 | 0.68 | 34 |
| 2487 | Casuarina, Chinderah, Cudgen, Duranbah, Fingal Head | NSW | Unit | 25.4 | 8.9 | 2.03 | 57 |
| 4211 | Advancetown, Beechmont, Binna Burra, Carrara, Clagiraba | QLD | Unit | 16.4 | 8.7 | 0.86 | 104 |
| 4209 | Canowindra, Coomera, Pimpama, Upper Coomera, Willow Vale | QLD | Unit | 24.9 | 8.6 | 0.46 | 76 |
| 2481 | Broken Head, Byron Bay, Ewingsdale, Myocum, Skinners Shoot | NSW | Unit | -9.0 | 8.5 | 1.63 | 32 |
| 4655 | Booral, Bunya Creek, Craignish, Dundowran, Dundowran Beach | QLD | Unit | 12.6 | 8.4 | 2.32 | 82 |
| 4227 | Reedy Creek, Varsity Lakes | QLD | Unit | 21.8 | 8.4 | 0.63 | 83 |
Rental pressure markets
The tables below rank eligible postcodes by vacancy rate, with ties broken by one-year capital growth. Each postcode appears once; where a postcode has both an eligible house and unit market, the property type shown is the one with the stronger one-year capital growth. Because vacancy is a rental measure that settled-sales counts do not validate, these tables end at the vacancy column. Tight-vacancy postcodes, led by the Palmwoods hinterland (4555) at effectively zero average vacancy across the quarter, suggest sustained rental-market pressure. The high-vacancy list is a caution flag: growth-corridor postcodes such as Rockbank and Thornhill Park (3335, 15.22%) and Beveridge (3753, 12.01%), along with Burrum Heads (4659, 9.08%) and the mining town of Moranbah (4744, 8.60%), illustrate how new supply, holiday-market dynamics or local industry cycles can leave landlords competing for tenants. Postcodes whose vacancy data averages fewer than 100 dwellings are left out of these rankings, so that a handful of listings cannot dominate the list.
Table 5.1: Top 20 lowest-vacancy postcodes
| Postcode | Key Localities | State | Property Type | 1 Year Growth % | 10 Yr Annualized Growth % | Vacancy Rate % |
|---|---|---|---|---|---|---|
| 4555 | Chevallum, Hunchy, Landers Shoot, Palmwoods | QLD | House | 14.2 | 8.5 | 0.05 |
| 2705 | Brobenah, Calorafield, Corbie Hill, Gogeldrie, Leeton | NSW | House | 10.1 | 7.1 | 0.12 |
| 3564 | Campaspe West, Echuca, Echuca East, Echuca South, Echuca Village | VIC | House | 0.7 | 7.1 | 0.13 |
| 6054 | Ashfield, Bassendean, Eden Hill, Kiara, Lockridge | WA | House | 25.8 | 5.0 | 0.15 |
| 3465 | Adelaide Lead, Alma, Bowenvale, Bung Bong, Cotswold | VIC | House | 4.8 | 7.7 | 0.15 |
| 5125 | Golden Grove, Golden Grove Village, Greenwith | SA | House | 7.9 | 7.6 | 0.16 |
| 3140 | Lilydale | VIC | House | 9.2 | 4.5 | 0.16 |
| 5043 | Ascot Park, Marion, Mitchell Park, Morphettville, Park Holme | SA | House | 11.0 | 7.9 | 0.17 |
| 7030 | Apsley, Arthurs Lake, Bagdad, Bagdad North, Bothwell | TAS | House | 13.2 | 10.4 | 0.18 |
| 4816 | Alligator Creek, Balgal Beach, Brookhill, Buchanan, Calcium | QLD | House | 29.6 | 7.3 | 0.19 |
| 5162 | Morphett Vale, Woodcroft | SA | House | 18.4 | 9.0 | 0.19 |
| 812 | Karama, Leanyer, Malak, Marrara, Northlakes | NT | House | 19.1 | 1.2 | 0.20 |
| 2360 | Auburn Vale, Bukkulla, Cherry Tree Hill, Copeton, Elsmore | NSW | House | 36.8 | 5.4 | 0.24 |
| 5540 | Bungama, Coonamia, Napperby, Nelshaby, Port Davis | SA | House | 7.1 | 5.7 | 0.24 |
| 7010 | Dowsing Point, Elwick, Glenorchy, Goodwood, Montrose | TAS | House | 16.7 | 8.7 | 0.25 |
| 6104 | Ascot, Belmont, Redcliffe | WA | House | 31.5 | 4.4 | 0.25 |
| 810 | Alawa, Brinkin, Casuarina, Jingili, Lee Point | NT | House | 27.8 | 1.6 | 0.25 |
| 7011 | Austins Ferry, Berriedale, Chigwell, Claremont | TAS | House | 23.6 | 8.3 | 0.25 |
| 2517 | Russell Vale, Woonona, Woonona East | NSW | House | 15.6 | 7.1 | 0.26 |
| 6061 | Balga, Mirrabooka, Nollamara, Westminster | WA | House | 26.4 | 4.6 | 0.26 |
Table 5.2: Top 20 highest-vacancy postcodes
| Postcode | Key Localities | State | Property Type | 1 Year Growth % | 10 Yr Annualized Growth % | Vacancy Rate % |
|---|---|---|---|---|---|---|
| 3335 | Plumpton, Rockbank, Bonnie Brook, Grangefields, Thornhill Park | VIC | House | 15.8 | 5.8 | 15.22 |
| 3753 | Beveridge | VIC | House | 1.1 | 5.4 | 12.01 |
| 4659 | Beelbi Creek, Burgowan, Burrum, Burrum Heads, Burrum River | QLD | House | 4.2 | 10.4 | 9.08 |
| 4744 | Moranbah, Peak Downs Mine | QLD | House | 13.5 | 8.1 | 8.60 |
| 2537 | Bergalia, Bingie, Broulee, Coila, Congo | NSW | House | 7.6 | 9.3 | 5.85 |
| 3024 | Mambourin, Mount Cottrell, Wyndham Vale, Fieldstone, Manor Lakes | VIC | House | 1.9 | 6.8 | 5.73 |
| 6211 | Bouvard, Dawesville, Herron, Clifton | WA | House | 24.0 | 6.5 | 5.36 |
| 3730 | Bathumi, Boosey, Bundalong, Bundalong South, Esmond | VIC | House | 15.6 | 7.2 | 5.33 |
| 3338 | Brookfield, Exford, Eynesbury, Melton South, Cobblebank | VIC | House | 12.6 | 9.9 | 5.08 |
| 3941 | Rye, St Andrews Beach, Tootgarook | VIC | House | -1.8 | 6.9 | 4.94 |
| 2179 | Austral, Leppington | NSW | House | 13.0 | 12.0 | 4.82 |
| 2000 | Darling Harbour, Dawes Point, Haymarket, Millers Point, Parliament House | NSW | Unit | 3.0 | -0.1 | 4.58 |
| 3842 | Churchill | VIC | House | 9.4 | 9.0 | 4.51 |
| 4567 | Castaways Beach, Little Cove, Noosa Heads, Sunrise Beach, Sunshine Beach | QLD | Unit | 27.2 | 11.2 | 4.34 |
| 4184 | Coochiemudlo Island, Karragarra Island, Lamb Island, Macleay Island, Peel Island | QLD | House | 35.9 | 19.5 | 4.24 |
| 2026 | Ben Buckler, Bondi, Bondi Beach, North Bondi, Tamarama | NSW | Unit | 13.4 | 4.6 | 4.22 |
| 3936 | Arthurs Seat, Dromana, Safety Beach | VIC | House | 10.2 | 6.4 | 4.10 |
| 3840 | Driffield, Hazelwood, Hazelwood North, Hazelwood South, Jeeralang | VIC | House | 23.3 | 8.4 | 3.88 |
| 2765 | Berkshire Park, Box Hill, Maraylya, Marsden Park, Nelson | NSW | House | 10.0 | 7.8 | 3.86 |
| 4217 | Benowa, Bundall, Chevron Island, Gold Coast Mc, Isle Of Capri | QLD | Unit | 20.0 | 7.7 | 3.83 |
Balanced growth and rental demand markets
The Balanced Score is a screening tool, not a recommendation. From the eligible universe we keep only markets with positive one-year capital growth, positive 10-year annualised capital growth and a vacancy rate at or below the national median of 0.99%; 456 markets qualified this quarter. Within that pool, one-year capital growth, 10-year capital growth and inverted vacancy are each min-max scaled, then combined as 35% one-year, 35% ten-year and 30% inverted vacancy, and expressed out of 100. A high score therefore indicates a market where recent momentum, a long-term capital growth record and tight rental conditions currently coincide; it says nothing about price point, yield, stock quality or forward risk, all of which require additional due diligence.
Queensland dominates both lists. Fitzgibbon and Taigum (4018) in Brisbane's north tops the house table with strong scores on all three legs, although its market depth sits right at the guardrail (30 settled sales in the thinner quarter). The Coomera to Pimpama corridor (4209) follows with exceptional market depth (207 settled sales in the thinner quarter), then the Inverell district (2360), a broad regional postcode that warrants extra due diligence. On the unit side, Brassall in Ipswich (4305), Inala in Brisbane's south west (4077) and the Beenleigh corridor (4207) lead, each combining near-30% or higher one-year capital growth with vacancy under 0.7%.
Table 6.1: Top 20 balanced house markets
| Postcode | Key Localities | State | Property Type | 1 Year Growth % | 10 Yr Annualized Growth % | Vacancy Rate % | Min Qtr Sales | Balanced Score |
|---|---|---|---|---|---|---|---|---|
| 4018 | Fitzgibbon, Taigum | QLD | House | 29.4 | 11.6 | 0.27 | 30 | 74.8 |
| 4209 | Canowindra, Coomera, Pimpama, Upper Coomera, Willow Vale | QLD | House | 22.8 | 15.0 | 0.46 | 207 | 70.6 |
| 2360 | Auburn Vale, Bukkulla, Cherry Tree Hill, Copeton, Elsmore | NSW | House | 36.8 | 5.4 | 0.24 | 59 | 67.2 |
| 4816 | Alligator Creek, Balgal Beach, Brookhill, Buchanan, Calcium | QLD | House | 29.6 | 7.3 | 0.19 | 50 | 67.1 |
| 4370 | Clintonvale, Cunningham, Elbow Valley, Freestone, Gladfield | QLD | House | 26.4 | 9.0 | 0.27 | 103 | 65.9 |
| 5038 | Camden Park, Plympton, Plympton Park, South Plympton | SA | House | 31.7 | 8.1 | 0.40 | 48 | 64.2 |
| 4054 | Arana Hills, Grovely, Keperra | QLD | House | 24.9 | 8.8 | 0.28 | 37 | 63.6 |
| 4514 | Bellthorpe, Cedarton, Commissioners Flat, D'aguilar, Delaneys Creek | QLD | House | 23.1 | 10.0 | 0.33 | 33 | 63.2 |
| 7011 | Austins Ferry, Berriedale, Chigwell, Claremont | TAS | House | 23.6 | 8.3 | 0.25 | 48 | 62.3 |
| 4519 | Beerwah, Coochin Creek, Crohamhurst, Peachester | QLD | House | 22.2 | 11.7 | 0.48 | 38 | 62.0 |
| 6060 | Dog Swamp, Joondanna, Tuart Hill, Yokine, Yokine South | WA | House | 35.0 | 4.4 | 0.30 | 46 | 61.3 |
| 5162 | Morphett Vale, Woodcroft | SA | House | 18.4 | 9.0 | 0.19 | 89 | 61.3 |
| 4555 | Chevallum, Hunchy, Landers Shoot, Palmwoods | QLD | House | 14.2 | 8.5 | 0.05 | 38 | 60.8 |
| 7030 | Apsley, Arthurs Lake, Bagdad, Bagdad North, Bothwell | TAS | House | 13.2 | 10.4 | 0.18 | 50 | 60.1 |
| 6104 | Ascot, Belmont, Redcliffe | WA | House | 31.5 | 4.4 | 0.25 | 34 | 59.8 |
| 7248 | Alanvale, Inveresk, Invermay, Mayfield, Mowbray | TAS | House | 34.1 | 8.7 | 0.65 | 51 | 59.6 |
| 6036 | Butler, Jindalee | WA | House | 27.7 | 5.9 | 0.27 | 65 | 59.6 |
| 6054 | Ashfield, Bassendean, Eden Hill, Kiara, Lockridge | WA | House | 25.8 | 5.0 | 0.15 | 34 | 59.5 |
| 4553 | Diamond Valley, Glenview, Mooloolah, Mooloolah Valley, Palmview | QLD | House | 32.4 | 12.1 | 0.86 | 68 | 59.4 |
| 4164 | Pinklands, Thornlands | QLD | House | 24.5 | 10.1 | 0.50 | 60 | 59.3 |
Table 6.2: Top 20 balanced unit markets
| Postcode | Key Localities | State | Property Type | 1 Year Growth % | 10 Yr Annualized Growth % | Vacancy Rate % | Min Qtr Sales | Balanced Score |
|---|---|---|---|---|---|---|---|---|
| 4305 | Basin Pocket, Brassall, Brassall Heights, Bremer, Churchill | QLD | Unit | 36.5 | 7.3 | 0.61 | 43 | 59.5 |
| 4077 | Doolandella, Durack, Inala, Inala East, Inala Heights | QLD | Unit | 29.2 | 6.7 | 0.39 | 54 | 59.1 |
| 4207 | Alberton, Bahrs Scrub, Bannockburn, Beenleigh, Belivah | QLD | Unit | 30.8 | 9.9 | 0.68 | 95 | 58.7 |
| 4018 | Fitzgibbon, Taigum | QLD | Unit | 23.5 | 6.9 | 0.27 | 33 | 58.4 |
| 4209 | Canowindra, Coomera, Pimpama, Upper Coomera, Willow Vale | QLD | Unit | 24.9 | 8.6 | 0.46 | 76 | 57.1 |
| 6056 | Baskerville, Bellevue, Boya, Greenmount, Helena Valley | WA | Unit | 34.0 | 4.7 | 0.44 | 40 | 56.8 |
| 6168 | Cooloongup, East Rockingham, Garden Island, Hillman, Peron | WA | Unit | 30.9 | 6.9 | 0.55 | 38 | 55.7 |
| 4510 | Balingool, Beachmere, Bellmere, Caboolture, Caboolture South | QLD | Unit | 36.9 | 8.1 | 0.84 | 46 | 54.7 |
| 2528 | Barrack Heights, Barrack Point, Lake Illawarra, Mount Warrigal, Warilla | NSW | Unit | 24.4 | 7.6 | 0.47 | 33 | 54.5 |
| 6060 | Dog Swamp, Joondanna, Tuart Hill, Yokine, Yokine South | WA | Unit | 27.8 | 4.2 | 0.30 | 55 | 54.4 |
| 4350 | Wellcamp, Westbrook, Wilsonton, Athol, Blue Mountain Heights | QLD | Unit | 34.4 | 5.5 | 0.60 | 151 | 54.0 |
| 4503 | Dakabin, Dohles Rocks, Griffin, Kallangur, Kurwongbah | QLD | Unit | 27.8 | 6.3 | 0.52 | 61 | 52.6 |
| 4301 | Collingwood Park, Greenwood Village, Redbank, Redbank Plains | QLD | Unit | 30.5 | 9.6 | 0.86 | 42 | 51.9 |
| 4032 | Chermside, Chermside South, Chermside West, Craigslea | QLD | Unit | 29.1 | 4.6 | 0.46 | 47 | 51.5 |
| 4053 | Everton Hills, Everton Park, McDowall, Mitchelton, Oxford Park | QLD | Unit | 26.4 | 5.6 | 0.48 | 72 | 51.0 |
| 4030 | Eildon Hill, Kalinga, Lutwyche, Windsor, Wooloowin | QLD | Unit | 24.1 | 4.5 | 0.37 | 49 | 49.7 |
| 4020 | Redcliffe, Redcliffe North, Scarborough, Newport | QLD | Unit | 26.9 | 6.7 | 0.62 | 57 | 49.5 |
| 2485 | Tweed Heads, Tweed Heads West | NSW | Unit | 18.1 | 9.4 | 0.60 | 78 | 48.8 |
| 4227 | Reedy Creek, Varsity Lakes | QLD | Unit | 21.8 | 8.4 | 0.63 | 83 | 48.6 |
| 4051 | Alderley, Enoggera, Gaythorne, Grange, Newmarket | QLD | Unit | 28.6 | 5.3 | 0.60 | 60 | 48.3 |
Watchlist markets
These three tables are monitoring lists, not opportunity lists. They isolate markets where the signals disagree, and disagreement is exactly where assumptions should be tested before capital is committed. The thresholds are data driven and recomputed each quarter on the eligible universe, with vacancy measured only for postcodes averaging at least 100 dwellings: tight vacancy is the 25th percentile (0.67% this quarter), high vacancy is the 75th percentile (1.50%), a strong long-term record is the 75th percentile of 10-year annualised capital growth (8.0%), and weak recent momentum is one-year capital growth at or below a fixed 2.0%.
Table 7.1: Rental pressure without momentum (vacancy at or below 0.67% and 1-year capital growth at or below 2.0%)
Twenty markets combine very tight rental conditions with flat or negative recent capital growth, mostly in Victoria and New South Wales. Tight vacancy suggests rental-market pressure and can precede price growth, but it can also persist for years without translating into capital growth; treat these as markets to watch, not to chase.
| Postcode | Key Localities | State | Property Type | 1 Year Growth % | 10 Yr Annualized Growth % | Vacancy Rate % | Min Qtr Sales |
|---|---|---|---|---|---|---|---|
| 3564 | Campaspe West, Echuca, Echuca East, Echuca South, Echuca Village | VIC | House | 0.7 | 7.1 | 0.13 | 44 |
| 832 | Gunn, Mitchell, Rosebery, Rosebery Heights, Bakewell | NT | Unit | 0.5 | -0.8 | 0.30 | 49 |
| 870 | Alice Springs, Araluen, Braitling, Ciccone, Desert Springs | NT | House | -2.0 | 0.8 | 0.32 | 43 |
| 2227 | Gymea, Gymea Bay | NSW | Unit | 0.4 | 4.6 | 0.37 | 30 |
| 3139 | Beenak, Don Valley, Hoddles Creek, Launching Place, Seville | VIC | House | 1.2 | 6.3 | 0.38 | 35 |
| 2731 | Bunnaloo, Moama, Tantonan, Womboota, Thyra | NSW | House | 1.9 | 6.7 | 0.44 | 38 |
| 2295 | Fern Bay, Stockton | NSW | House | 0.9 | 15.5 | 0.46 | 33 |
| 2528 | Barrack Heights, Barrack Point, Lake Illawarra, Mount Warrigal, Warilla | NSW | House | 1.9 | 7.4 | 0.47 | 58 |
| 3136 | Croydon, Croydon Hills, Croydon North, Croydon South | VIC | Unit | 0.8 | 4.7 | 0.49 | 61 |
| 2478 | Ballina, Coolgardie, Cumbalum, East Ballina, Empire Vale | NSW | House | -0.9 | 9.5 | 0.50 | 98 |
| 6156 | Attadale, Melville, Willagee, Willagee Central | WA | House | 0.0 | 7.5 | 0.50 | 39 |
| 3088 | Briar Hill, Greensborough, Saint Helena, St Helena | VIC | House | -1.0 | 5.0 | 0.59 | 57 |
| 3070 | Northcote, Northcote South | VIC | Unit | -3.2 | 1.4 | 0.60 | 51 |
| 3178 | Rowville | VIC | House | 0.9 | 5.3 | 0.61 | 68 |
| 3195 | Aspendale, Aspendale Gardens, Braeside, Mordialloc, Mordialloc North | VIC | Unit | -6.2 | 3.7 | 0.61 | 54 |
| 3195 | Aspendale, Aspendale Gardens, Braeside, Mordialloc, Mordialloc North | VIC | House | -3.7 | 5.9 | 0.61 | 55 |
| 3071 | Thornbury | VIC | House | -4.8 | 4.6 | 0.62 | 30 |
| 3250 | Colac, Colac East, Colac West, Elliminyt | VIC | House | -2.0 | 7.4 | 0.62 | 40 |
| 2484 | Back Creek, Boat Harbour, Bray Park, Brays Creek, Byangum | NSW | House | -3.9 | 10.3 | 0.63 | 73 |
| 3194 | Mentone, Mentone East, Moorabbin Airport | VIC | Unit | -25.5 | 3.4 | 0.66 | 39 |
Table 7.2: Cooling long-term performers (10-year annualised capital growth at or above 8.0% and 1-year capital growth at or below 2.0%)
Sixteen markets with a top-quartile decade have stalled over the past year, including Fern Bay and Stockton (2295), Officer (3809) and the Noosa Heads house market (4567). A strong decade followed by a flat year can mark a pause, a peak or a rotation of demand; the direction is not knowable from two data points, which is precisely why these sit on a watchlist.
| Postcode | Key Localities | State | Property Type | 1 Year Growth % | 10 Yr Annualized Growth % | Vacancy Rate % | Min Qtr Sales |
|---|---|---|---|---|---|---|---|
| 2295 | Fern Bay, Stockton | NSW | House | 0.9 | 15.5 | 0.46 | 33 |
| 3809 | Officer, Officer South | VIC | House | -1.7 | 12.8 | 1.50 | 111 |
| 4567 | Castaways Beach, Little Cove, Noosa Heads, Sunrise Beach, Sunshine Beach | QLD | House | -8.5 | 11.8 | 4.34 | 47 |
| 2484 | Back Creek, Boat Harbour, Bray Park, Brays Creek, Byangum | NSW | House | -3.9 | 10.3 | 0.63 | 73 |
| 2483 | Billinudgel, Brunswick Heads, Burringbar, Crabbes Creek, Middle Pocket | NSW | House | -2.6 | 10.1 | 0.75 | 36 |
| 2539 | Bawley Point, Bendalong, Berringer Lake, Burrill Lake, Conjola | NSW | House | -2.1 | 9.6 | 2.07 | 117 |
| 2478 | Ballina, Coolgardie, Cumbalum, East Ballina, Empire Vale | NSW | House | -0.9 | 9.5 | 0.50 | 98 |
| 2463 | Ashby, Ashby Heights, Brooms Head, Gulmarrad, Ilarwill | NSW | House | -4.2 | 9.0 | 1.13 | 44 |
| 2546 | Akolele, Barragga Bay, Beauty Point, Bermagui, Bermagui South | NSW | House | -0.8 | 9.0 | 2.24 | 46 |
| 2575 | Alpine, Aylmerton, Barrallier, Braemar, Bullio | NSW | House | -8.8 | 9.0 | 1.03 | 75 |
| 2620 | Burbong, Burra, Carwoola, Clear Range, Dodsworth | NSW | House | 0.0 | 8.7 | 1.18 | 168 |
| 4061 | The Gap | QLD | House | -1.0 | 8.6 | 0.67 | 48 |
| 2291 | Merewether, Merewether Heights, The Junction | NSW | House | -15.7 | 8.5 | 1.36 | 44 |
| 2481 | Broken Head, Byron Bay, Ewingsdale, Myocum, Skinners Shoot | NSW | Unit | -9.0 | 8.5 | 1.63 | 32 |
| 2155 | Beaumont Hills, Kellyville, Kellyville Ridge, Rouse Hill, North Kellyville | NSW | House | 1.4 | 8.5 | 1.75 | 207 |
| 2590 | Bethungra, Cootamundra, Illabo | NSW | House | -3.4 | 8.4 | 1.19 | 40 |
Table 7.3: High-vacancy risk (vacancy at or above 1.50% and 1-year capital growth at or below 2.0%)
Fifty nine markets combine elevated vacancy with weak recent capital growth, the least comfortable pairing in this report; the table lists the 20 with the highest vacancy, led by Beveridge (3753) and the Wyndham Vale and Manor Lakes corridor (3024). Softer tenant demand alongside stalling prices increases holding risk, and any exposure here should be underpinned by asset-specific and locality-specific work rather than postcode level figures.
| Postcode | Key Localities | State | Property Type | 1 Year Growth % | 10 Yr Annualized Growth % | Vacancy Rate % | Min Qtr Sales |
|---|---|---|---|---|---|---|---|
| 3753 | Beveridge | VIC | House | 1.1 | 5.4 | 12.01 | 39 |
| 3024 | Mambourin, Mount Cottrell, Wyndham Vale, Fieldstone, Manor Lakes | VIC | House | 1.9 | 6.8 | 5.73 | 207 |
| 3941 | Rye, St Andrews Beach, Tootgarook | VIC | House | -1.8 | 6.9 | 4.94 | 58 |
| 4567 | Castaways Beach, Little Cove, Noosa Heads, Sunrise Beach, Sunshine Beach | QLD | House | -8.5 | 11.8 | 4.34 | 47 |
| 2850 | Aarons Pass, Apple Tree Flat, Avisford, Bara, Barigan | NSW | House | -0.1 | 7.7 | 3.68 | 113 |
| 3205 | South Melbourne | VIC | Unit | -5.1 | 0.3 | 2.92 | 40 |
| 2033 | Kensington | NSW | Unit | -10.5 | 2.2 | 2.61 | 36 |
| 2602 | Ainslie, Dickson, Downer, Hackett, Lyneham | ACT | Unit | -2.9 | 3.7 | 2.45 | 53 |
| 2075 | North St Ives, St Ives, St Ives Chase | NSW | Unit | -7.1 | 3.8 | 2.45 | 32 |
| 2075 | North St Ives, St Ives, St Ives Chase | NSW | House | -5.7 | 6.9 | 2.45 | 38 |
| 3631 | Arcadia, Arcadia South, Cosgrove, Cosgrove South, Grahamvale | VIC | House | -12.6 | 7.9 | 2.42 | 36 |
| 2315 | Corlette, Fingal Bay, Gan Gan, Nelson Bay, Shoal Bay | NSW | Unit | -2.1 | 7.2 | 2.38 | 47 |
| 2022 | Bondi Junction, Queens Park | NSW | Unit | -10.2 | 3.6 | 2.34 | 40 |
| 3223 | Indented Head, Portarlington, St Leonards, Bellarine | VIC | House | 1.0 | 7.3 | 2.34 | 55 |
| 2221 | Blakehurst, Carss Park, Connells Point, Kyle Bay, South Hurstville | NSW | House | -16.6 | 5.1 | 2.28 | 37 |
| 2037 | Forest Lodge, Glebe | NSW | Unit | -7.6 | 1.4 | 2.26 | 55 |
| 2546 | Akolele, Barragga Bay, Beauty Point, Bermagui, Bermagui South | NSW | House | -0.8 | 9.0 | 2.24 | 46 |
| 2074 | Bobbin Head, North Turramurra, South Turramurra, Turramurra, Warrawee | NSW | Unit | -14.6 | 0.3 | 2.21 | 40 |
| 2074 | Bobbin Head, North Turramurra, South Turramurra, Turramurra, Warrawee | NSW | House | -1.9 | 6.1 | 2.21 | 52 |
| 2536 | Batehaven, Batemans Bay, Benandarah, Bimbimbie, Buckenbowra | NSW | Unit | -8.8 | 7.9 | 2.20 | 33 |
House versus unit comparison
For the 191 postcodes with both an eligible house and an eligible unit market, the tables below show the largest performance gaps in each direction, over one year and over ten years. A positive Diff means houses outperformed units; a negative Diff means units outperformed houses. The one-year gaps can be striking: in Leichhardt and Lilyfield (2040) houses gained 15.2% capital growth while units fell 20.9%, a 36.1 point gap, while in Noosa Heads (4567) units gained 27.2% against an 8.5% fall for houses. Gaps this wide are often composition effects, differences in the stock transacting from one year to the next, rather than clean price divergence, and they should not be treated as a standalone buy signal for the lagging or leading segment. The 10-year tables are the more reliable read on structural preference: only eight postcodes recorded stronger 10-year capital growth for units than houses, and in each case by less than one point.
Table 8.1: Largest 1-year gaps where houses outperformed units
| Postcode | Key Localities | State | House 1 Yr Growth % | Unit 1 Yr Growth % | Diff 1yr | House 10 Yr Growth % p.a. | Unit 10 Yr Growth % p.a. | Diff 10yr | Vacancy Rate % |
|---|---|---|---|---|---|---|---|---|---|
| 2040 | Leichhardt, Lilyfield | NSW | 15.2 | -20.9 | +36.1 | 5.7 | 1.8 | +3.9 | 0.88 |
| 3196 | Bonbeach, Chelsea, Chelsea Heights, Edithvale | VIC | 19.5 | -4.4 | +23.9 | 5.2 | 4.6 | +0.6 | 0.70 |
| 832 | Gunn, Mitchell, Rosebery, Rosebery Heights, Bakewell | NT | 22.6 | 0.5 | +22.1 | 1.0 | -0.8 | +1.8 | 0.30 |
| 2141 | Berala, Lidcombe, Lidcombe North, Rookwood | NSW | 18.9 | -3.2 | +22.1 | 5.0 | 2.8 | +2.2 | 1.62 |
| 2770 | Bidwill, Blackett, Dharruk, Emerton, Hebersham | NSW | 15.2 | -4.9 | +20.1 | 6.5 | 2.0 | +4.5 | 0.75 |
| 3058 | Batman, Coburg, Coburg North, Merlynston, Moreland | VIC | 7.8 | -11.4 | +19.1 | 5.0 | 3.3 | +1.7 | 0.79 |
| 3072 | Gilberton, Preston, Preston Lower, Preston South, Preston West | VIC | 15.1 | -3.2 | +18.3 | 4.2 | 2.3 | +2.0 | 1.19 |
| 2602 | Ainslie, Dickson, Downer, Hackett, Lyneham | ACT | 14.9 | -2.9 | +17.8 | 5.4 | 3.7 | +1.7 | 2.45 |
| 2148 | Arndell Park, Blacktown, Blacktown Westpoint, Huntingwood, Kings Park | NSW | 9.9 | -7.6 | +17.5 | 5.7 | 1.1 | +4.6 | 1.14 |
| 2536 | Batehaven, Batemans Bay, Benandarah, Bimbimbie, Buckenbowra | NSW | 8.4 | -8.8 | +17.2 | 8.2 | 7.9 | +0.3 | 2.20 |
| 4557 | Mooloolaba, Mountain Creek | QLD | 20.0 | 3.1 | +16.9 | 9.8 | 7.9 | +2.0 | 0.40 |
| 2481 | Broken Head, Byron Bay, Ewingsdale, Myocum, Skinners Shoot | NSW | 7.6 | -9.0 | +16.6 | 9.6 | 8.5 | +1.1 | 1.63 |
| 3021 | Albanvale, Kealba, Kings Park, St Albans | VIC | 14.5 | 1.1 | +13.4 | 6.2 | 5.3 | +0.8 | 0.74 |
| 2617 | Belconnen, Bruce, Evatt, Giralang, Kaleen | ACT | 10.9 | -2.0 | +12.9 | 4.9 | 2.9 | +2.0 | 0.87 |
| 2074 | Bobbin Head, North Turramurra, South Turramurra, Turramurra, Warrawee | NSW | -1.9 | -14.6 | +12.8 | 6.1 | 0.3 | +5.8 | 2.21 |
| 3012 | Brooklyn, Kingsville, Kingsville West, Maidstone, Tottenham | VIC | 0.6 | -11.9 | +12.4 | 3.6 | 1.7 | +1.8 | 1.04 |
| 2762 | Schofields, Tallawong | NSW | 6.9 | -5.5 | +12.4 | 11.3 | 1.4 | +10.0 | 1.90 |
| 2046 | Abbotsford, Canada Bay, Chiswick, Five Dock, Rodd Point | NSW | 16.8 | 4.7 | +12.1 | 6.8 | 3.9 | +2.9 | 1.32 |
| 2760 | Colyton, North St Marys, Oxley Park, St Marys, St Marys East | NSW | 21.1 | 9.7 | +11.4 | 6.3 | 5.2 | +1.1 | 1.10 |
| 2137 | Breakfast Point, Cabarita, Concord, Mortlake, North Strathfield | NSW | 2.0 | -9.2 | +11.2 | 5.9 | 1.5 | +4.4 | 1.58 |
Table 8.2: Largest 1-year gaps where units outperformed houses
| Postcode | Key Localities | State | House 1 Yr Growth % | Unit 1 Yr Growth % | Diff 1yr | House 10 Yr Growth % p.a. | Unit 10 Yr Growth % p.a. | Diff 10yr | Vacancy Rate % |
|---|---|---|---|---|---|---|---|---|---|
| 4567 | Castaways Beach, Little Cove, Noosa Heads, Sunrise Beach, Sunshine Beach | QLD | -8.5 | 27.2 | -35.7 | 11.8 | 11.2 | +0.5 | 4.34 |
| 4802 | Airlie Beach, Cannonvale, Flametree, Jubilee Pocket, Mandalay | QLD | 4.6 | 39.9 | -35.3 | 8.7 | 4.8 | +3.9 | 0.99 |
| 2230 | Bundeena, Burraneer, Cronulla, Maianbar, Woolooware | NSW | -10.8 | 13.5 | -24.2 | 7.1 | 4.2 | +2.9 | 1.80 |
| 2528 | Barrack Heights, Barrack Point, Lake Illawarra, Mount Warrigal, Warilla | NSW | 1.9 | 24.4 | -22.5 | 7.4 | 7.6 | -0.2 | 0.47 |
| 2065 | Crows Nest, Gore Hill, Greenwich, Naremburn, Royal North Shore Hospital | NSW | -5.4 | 16.7 | -22.0 | 5.7 | 2.7 | +3.1 | 1.77 |
| 3175 | Bangholme, Dandenong, Dandenong East, Dandenong North, Dandenong South | VIC | 5.7 | 26.2 | -20.5 | 4.9 | 3.3 | +1.6 | 1.54 |
| 2166 | Cabramatta, Cabramatta West, Canley Heights, Canley Vale, Lansvale | NSW | 6.3 | 26.1 | -19.8 | 5.9 | 1.3 | +4.6 | 1.40 |
| 2042 | Enmore, Newtown | NSW | -0.3 | 19.1 | -19.4 | 4.3 | 2.7 | +1.6 | 1.02 |
| 4171 | Balmoral, Bulimba, Galloways Hill, Hawthorne | QLD | 11.5 | 30.7 | -19.2 | 7.4 | 4.7 | +2.7 | 0.93 |
| 4350 | Wellcamp, Westbrook, Wilsonton, Athol, Blue Mountain Heights | QLD | 15.7 | 34.4 | -18.7 | 7.9 | 5.5 | +2.4 | 0.60 |
| 4020 | Redcliffe, Redcliffe North, Scarborough, Newport | QLD | 8.7 | 26.9 | -18.2 | 10.2 | 6.7 | +3.5 | 0.62 |
| 4510 | Balingool, Beachmere, Bellmere, Caboolture, Caboolture South | QLD | 19.5 | 36.9 | -17.4 | 10.7 | 8.1 | +2.6 | 0.84 |
| 2487 | Casuarina, Chinderah, Cudgen, Duranbah, Fingal Head | NSW | 8.7 | 25.4 | -16.7 | 14.3 | 8.9 | +5.5 | 2.03 |
| 2010 | Darlinghurst, Surry Hills, Taylor Square | NSW | -11.7 | 4.9 | -16.6 | 5.6 | 0.9 | +4.7 | 1.67 |
| 6008 | Daglish, Shenton Park, Subiaco, Subiaco East | WA | 6.9 | 23.1 | -16.2 | 4.9 | 2.7 | +2.2 | 1.00 |
| 4068 | Chelmer, Indooroopilly, Long Pocket, Taringa | QLD | 2.7 | 18.7 | -16.0 | 8.3 | 4.8 | +3.5 | 1.86 |
| 4030 | Eildon Hill, Kalinga, Lutwyche, Windsor, Wooloowin | QLD | 8.8 | 24.1 | -15.3 | 7.0 | 4.5 | +2.5 | 0.37 |
| 4227 | Reedy Creek, Varsity Lakes | QLD | 7.7 | 21.8 | -14.1 | 10.3 | 8.4 | +1.9 | 0.63 |
| 4305 | Basin Pocket, Brassall, Brassall Heights, Bremer, Churchill | QLD | 22.7 | 36.5 | -13.8 | 10.1 | 7.3 | +2.8 | 0.61 |
| 3155 | Boronia | VIC | -0.5 | 13.1 | -13.6 | 4.5 | 5.0 | -0.5 | 0.70 |
Table 8.3: Largest 10-year gaps where houses outperformed units
| Postcode | Key Localities | State | House 1 Yr Growth % | Unit 1 Yr Growth % | Diff 1yr | House 10 Yr Growth % p.a. | Unit 10 Yr Growth % p.a. | Diff 10yr | Vacancy Rate % |
|---|---|---|---|---|---|---|---|---|---|
| 2762 | Schofields, Tallawong | NSW | 6.9 | -5.5 | +12.4 | 11.3 | 1.4 | +10.0 | 1.90 |
| 2155 | Beaumont Hills, Kellyville, Kellyville Ridge, Rouse Hill, North Kellyville | NSW | 1.4 | 4.3 | -2.9 | 8.5 | 0.0 | +8.5 | 1.75 |
| 2135 | Strathfield | NSW | 3.0 | 6.0 | -2.9 | 6.8 | 0.3 | +6.6 | 1.81 |
| 4209 | Canowindra, Coomera, Pimpama, Upper Coomera, Willow Vale | QLD | 22.8 | 24.9 | -2.0 | 15.0 | 8.6 | +6.4 | 0.46 |
| 2112 | Denistone East, Putney, Ryde | NSW | 8.3 | 6.9 | +1.4 | 6.0 | 0.2 | +5.8 | 1.17 |
| 4740 | Alexandra, Alligator Creek, Andergrove, Bakers Creek, Balberra | QLD | 13.6 | 23.9 | -10.3 | 6.5 | 0.7 | +5.8 | 1.11 |
| 4064 | Paddington, Rosalie, Baroona, Milton | QLD | 21.0 | 27.4 | -6.3 | 9.1 | 3.3 | +5.8 | 0.62 |
| 2074 | Bobbin Head, North Turramurra, South Turramurra, Turramurra, Warrawee | NSW | -1.9 | -14.6 | +12.8 | 6.1 | 0.3 | +5.8 | 2.21 |
| 2118 | Carlingford, Carlingford Court, Carlingford North, Kingsdene | NSW | 5.8 | 3.8 | +2.0 | 5.7 | 0.1 | +5.6 | 1.03 |
| 2161 | Guildford, Guildford West, Old Guildford, Yennora | NSW | 6.8 | 4.2 | +2.6 | 5.6 | -0.0 | +5.6 | 1.14 |
| 2487 | Casuarina, Chinderah, Cudgen, Duranbah, Fingal Head | NSW | 8.7 | 25.4 | -16.7 | 14.3 | 8.9 | +5.5 | 2.03 |
| 2121 | Epping, North Epping | NSW | -9.3 | -3.6 | -5.7 | 5.1 | -0.3 | +5.4 | 1.16 |
| 2165 | Fairfield, Fairfield East, Fairfield Heights, Fairfield West | NSW | 15.9 | 5.9 | +10.0 | 5.7 | 0.3 | +5.4 | 1.31 |
| 2620 | Burbong, Burra, Carwoola, Clear Range, Dodsworth | NSW | 0.0 | -10.3 | +10.3 | 8.7 | 3.5 | +5.3 | 1.18 |
| 2036 | Chifley, Eastgardens, Hillsdale, La Perouse, Little Bay | NSW | -4.5 | 5.4 | -9.9 | 6.3 | 1.1 | +5.2 | 1.56 |
| 2114 | Denistone, Denistone West, Meadowbank, Melrose Park, West Ryde | NSW | 5.6 | 6.5 | -0.9 | 5.4 | 0.3 | +5.1 | 1.27 |
| 2145 | Westmead, Girraween, Greystanes, Mays Hill, Pemulwuy | NSW | 6.5 | -0.8 | +7.4 | 5.6 | 0.5 | +5.1 | 1.15 |
| 4703 | Adelaide Park, Bangalee, Barlows Hill, Barmaryee, Barmoya | QLD | 18.4 | 21.2 | -2.8 | 8.8 | 3.8 | +5.0 | 0.89 |
| 2160 | Merrylands, Merrylands West | NSW | 7.4 | 10.5 | -3.2 | 5.4 | 0.5 | +5.0 | 1.48 |
| 2113 | Blenheim Road, East Ryde, Macquarie Park, North Ryde | NSW | 2.0 | 9.7 | -7.7 | 6.1 | 1.2 | +4.9 | 1.44 |
Table 8.4: Largest 10-year gaps where units outperformed houses
| Postcode | Key Localities | State | House 1 Yr Growth % | Unit 1 Yr Growth % | Diff 1yr | House 10 Yr Growth % p.a. | Unit 10 Yr Growth % p.a. | Diff 10yr | Vacancy Rate % |
|---|---|---|---|---|---|---|---|---|---|
| 4214 | Arundel, Ashmore, Ashmore City, Molendinar, Parkwood | QLD | 15.4 | 11.5 | +3.9 | 8.8 | 9.5 | -0.7 | 1.10 |
| 3156 | Ferntree Gully, Lysterfield, Lysterfield South, Mountain Gate, Upper Ferntree Gully | VIC | 4.8 | 7.9 | -3.1 | 4.6 | 5.1 | -0.5 | 0.91 |
| 3073 | Keon Park, Reservoir, Reservoir East, Reservoir North, Reservoir South | VIC | 13.1 | 10.6 | +2.5 | 4.3 | 4.8 | -0.5 | 1.04 |
| 3155 | Boronia | VIC | -0.5 | 13.1 | -13.6 | 4.5 | 5.0 | -0.5 | 0.70 |
| 4221 | Elanora, Palm Beach | QLD | 11.7 | 12.7 | -1.0 | 10.5 | 10.9 | -0.4 | 1.63 |
| 2528 | Barrack Heights, Barrack Point, Lake Illawarra, Mount Warrigal, Warilla | NSW | 1.9 | 24.4 | -22.5 | 7.4 | 7.6 | -0.2 | 0.47 |
| 4870 | Aeroglen, Brinsmead, Bungalow, Cairns, Cairns Central | QLD | 13.0 | 16.8 | -3.8 | 6.1 | 6.2 | -0.1 | 0.67 |
| 2227 | Gymea, Gymea Bay | NSW | 7.0 | 0.4 | +6.6 | 4.6 | 4.6 | -0.0 | 0.37 |
Investor implications
The momentum map and the track-record map are different maps. Western Australia and the Northern Territory own the one-year capital growth tables, but their 10-year medians are middling to weak. Queensland and Tasmania rank highly on both horizons, and Queensland, with far greater market depth (242 eligible markets against Tasmania's 12), dominates the balanced tables. Investors extrapolating WA's 24.8% house and 27.8% unit medians forward should remember that the state's decade-long annualised figure is 5.6% for houses: fast years and flat stretches average out. Extreme single-year growth, particularly the high-30s figures at the top of the leader tables, warrants scepticism and requires additional due diligence before it informs any decision.
Vacancy is doing a lot of work in the current market. With just over half the eligible postcodes under 1% vacancy, tight rental conditions are close to the national norm rather than a point of difference. That cuts two ways: low vacancy alone is a weak differentiator when it is so widespread, but the high-vacancy tail (Section 5 and Table 7.3) is genuinely informative, particularly in outer growth corridors where new supply is arriving. The median of 0.99% for April to June 2026 is in line with the 1.00% reported for the same period in our previous edition and up from about 0.90% in January to March 2026, a small move worth monitoring rather than acting on.
Alignment is the strongest single screen in this report. Markets appearing across the one-year tables, the 10-year tables and the balanced tables, such as the Coomera corridor, Beenleigh and parts of Brisbane's and Ipswich's affordable middle ring, are worth further investigation because three independent measures agree. Conversely, momentum without a track record (Section 4) and track record without momentum (Table 7.2) are both single-signal stories. Postcode level figures can also mask wide variation between localities, especially in broad rural postcodes, so suburb and asset level work remains essential. Capital growth and rental demand should be assessed together, and neither replaces professional advice on an investor's individual circumstances.
Executive summary
The year to Q2 2026 again rewarded the smaller capitals and the regions. Across the 984 eligible postcode markets (899 last quarter), median one-year capital growth reached 13.0% for houses and 10.7% for units, with the distribution skewed toward Western Australia (24.8% house median, 27.8% unit median), the Northern Territory, Queensland, Tasmania and South Australia. New South Wales, Victoria and the ACT recorded single-digit medians, and ACT unit markets barely grew (1.1%). About 12% of eligible markets recorded negative capital growth for the year, a useful reminder that a strong national median is not a universal experience.
Over ten years the ranking inverts in important ways. Queensland (8.8% annualised house median) and Tasmania (8.6%) hold the strongest long-term records, while Western Australia's decade figure of 5.6% shows its current run is recovering lost ground, and the Northern Territory's near-flat decade urges caution about reading its current momentum as trend. Houses have out-compounded units over the decade in every state, most sharply in New South Wales and Victoria, although units out-grew houses over the past year in Queensland, Western Australia and South Australia, led by affordable metropolitan and regional unit markets such as Caboolture (4510), Brassall (4305) and Beenleigh (4207) in south east Queensland.
Rental conditions remain tight. The median vacancy rate across eligible markets for the April to June 2026 quarter is 0.99%, 51% of eligible postcodes sit below 1%, and in the Northern Territory and Tasmania every eligible postcode does. The high-vacancy tail includes growth-corridor postcodes such as Rockbank and Thornhill Park (3335, 15.22%) and Beveridge (3753, 12.01%) where supply is running ahead of tenant demand. The watchlists in Section 7 flag 20 tight-vacancy markets without price momentum, 16 strong-decade markets that have stalled, and 59 markets pairing elevated vacancy with weak recent capital growth, of which the 20 highest-vacancy are tabled.
The quarter's clearest signal is again alignment. A relatively small set of markets, concentrated in south east Queensland's growth corridors and Brisbane's affordable middle ring, combine positive recent capital growth, a top-tier 10-year record, tight vacancy and genuine market depth. Those markets top the balanced tables in Section 6 and are worth further investigation. Everything else in the leader tables carries at least one caveat, whether a missing track record, a thin market just above the depth guardrail, a broad rural postcode or extreme single-year growth, and requires additional due diligence before any capital decision.
Methodology and data guardrails
Data inputs. Four datasets were used for this quarter: (1) one-year capital growth per postcode and property type comparing Q2 2026 (April to June 2026) with Q2 2025 (April to June 2025), with settled-sales counts for both quarters supplied in a companion file for the same period (see below); (2) 10-year annualised capital growth per postcode and property type (2015 to 2025); (3) monthly postcode level vacancy data (listings, dwellings and vacancy rate) for April to June 2026; and (4) the public Australian postcodes reference used to attach localities and states. Postcodes were standardised to integers, property types to House and Unit, and vacancy converted to a percentage. Eight blank or attribution rows in the growth file were removed before processing.
Vacancy period. The vacancy file supplied covers the three months April to June 2026; each postcode's vacancy rate in this report is the simple average of those three monthly rates. Months with no recorded dwellings carry no rate and were not counted; every eligible postcode had a rate for all three months. This is the same vacancy period used in our previous edition (median 1.00% across its eligible markets), and the January to March 2026 median of about 0.90% is quoted as a further reference point. A minimum-dwellings rule (below) applies to all vacancy measures. Vacancy is postcode level only and is not split by property type.
Settled-sales volumes. The one-year capital growth figures come from a growth file that does not carry settled-sales counts. The counts for each quarter (April to June 2025 and April to June 2026) were taken from the companion sales file for the same period and joined on postcode and property type. Of the 3,173 growth markets, 2,994 (94.4%) found a matching sales count; the 179 that did not were excluded, because their market depth cannot be verified.
Minimum dwellings for vacancy (100). Vacancy rates are only meaningful where the underlying dwelling base is large enough for a few listings not to swing the result. Postcodes whose vacancy data averaged fewer than 100 dwellings across April to June 2026 were therefore excluded from every vacancy-based measure: the national and state vacancy medians, the share under 1%, the percentile thresholds, the rental pressure tables, the Balanced Score and all three watchlists. At 100 dwellings a single listing moves the rate by about one percentage point. The rule removed two eligible markets: postcode 3851 houses (an average of 15 dwellings and a 39.33% average vacancy rate) and postcode 5117 houses (68 dwellings and 19.61%). Both remain in the eligible universe for the capital growth measures. Raising the minimum to 200 dwellings would have removed only two more postcodes (3351 and 3799), neither with an outlying vacancy rate, so 100 was retained as the least intrusive defensible cut-off.
Market-depth guardrail (30 settled sales). Only postcode markets with at least 30 settled sales in both quarters (Q2 2025 and Q2 2026) are retained; the binding constraint is the thinner quarter, reported in the tables as Min Qtr Sales. This depth rule substitutes for a minimum-dwellings rule: no dwelling-count field is supplied with the growth data, and settled-sales counts are a stronger, direct measure of transaction depth than dwelling stock in any case. The guardrail removed 1,998 of the 2,994 markets with sales counts, leaving 996; two further markets (3336 and 3358 houses) were dropped because they had no matching 10-year history.
Extreme-growth cap (40%). Seven postcodes recorded one-year capital growth above 40% in at least one property type: 3020, 4114, 4225, 4561, 6014, 6101 and 6163. All rows for those postcodes (10 markets) were excluded from the headline rankings, every table and every chart. Growth at that pace within a single year is more often a symptom of compositional change or a thin prior base than of underlying appreciation, and including it would distort the leader tables. The remaining 984 markets across 793 postcodes form the eligible universe.
Watchlist thresholds (this quarter's values). Computed on the eligible universe (vacancy thresholds on the 982 markets that pass the 100-dwelling vacancy rule): tight vacancy is the 25th percentile, 0.67%; high vacancy is the 75th percentile, 1.50%; a strong long-term record is the 75th percentile of 10-year annualised capital growth, 8.0%; weak recent momentum is a fixed threshold of one-year capital growth at or below 2.0%. The balanced-score pool additionally requires vacancy at or below the national median of 0.99%, and 456 markets qualified.
Locality cleaning. From the postcodes reference (Matthew Proctor's public Australian Postcodes dataset, australian_postcodes.csv, GitHub release of 7 September 2025), rows typed Post Office Boxes or LVR were dropped. Locality names containing (as whole words) DC, BC, PO, MALL, PLAZA, CENTRE or SHOPPING, or the phrases POST OFFICE, BUSINESS CENTRE or DELIVERY CENTRE, were treated as non-residential and removed; whole-word matching ensures genuine names such as Mallacoota are untouched. Names were then smart title-cased (including Mc and O' prefixes), de-duplicated case-insensitively, and up to five key localities retained per postcode in the reference's own order. Each postcode's state is the most common state in the reference, with a postcode-range fallback where a postcode is absent.
Vacancy Rate, indicates the percentage of properties that are currently unoccupied in that postcode, It’s a key indicator for investors to assess the rental demand.
Explore current investment properties at ausinvestmentproperties.com.au
Data attributions: The supplied growth datasets carry the following required acknowledgements. New South Wales: contains property sales information provided under licence from the Valuer General New South Wales; SQM Research Pty Ltd is authorised as a Property Sales Information Provider by the Valuer General of New South Wales. Queensland: © State of Queensland (Department of Resources) 2024; the State gives no warranty in relation to the data (including accuracy, reliability, completeness, currency or suitability) and accepts no liability (including without limitation, liability in negligence) for any loss, damage or costs (including consequential damage) relating to any use of the data; data must not be used for direct marketing or be used in breach of the privacy laws.
Disclaimer: To give this report credibility, postcode markets with fewer than 30 settled sales in a quarter have been excluded, so that every figure reflects a market with genuine transaction depth rather than a small number of isolated sales. Postcodes whose vacancy data averages fewer than 100 dwellings over the quarter were also left out of the vacancy rankings, the Balanced Score and the watchlists, because a handful of listings in so small a base produces vacancy rates that do not represent the wider market. Postcodes recording one-year growth above 40% were also held out of the headline rankings, to keep extreme single-year movements from distorting the leader tables. This report is general information only and does not constitute financial, legal, taxation, credit, investment or superannuation advice. It does not take account of any individual's circumstances or objectives, and the market data should be used only as a starting point for further due diligence. Investors should seek advice from appropriately qualified professionals before making any investment decision. Figures are derived solely from the supplied datasets for the stated periods and are subject to the data limitations described in the methodology. Past performance is not a reliable indicator of future performance.