_1782260843k7NEq-cover.png)

_1782260843k7NEq.png)
General market information for residential property investors
Reporting period: Q1 2026
1. TLDR This quarter reads as a growth-led market with broad rental tightness underneath it. Across the postcode markets with sufficient sales depth, capital growth was the dominant signal, while vacancy was extremely tight almost everywhere, so the two signals are pointing the same way in many markets, but for different reasons.
- Capital growth led the quarter. Median 1-year growth across eligible postcode markets was 12.6%, with only 10.6% of markets recording a fall. Median 10-year annualised growth was 6.4%.
- Rental markets are tight nationwide. The median vacancy rate was 0.86%, and 62.5% of markets sat under 1%. This suggests rental-market pressure is widespread rather than isolated to a few areas.
- Houses are the stronger property-type signal. Houses led units on capital growth over both horizons, with median capital growth of 12.9% versus 11.2% over one year, and a wider gap over ten years (annualised capital growth of 7.1% versus 3.6%).
- Western Australia, the Northern Territory and Queensland led recent capital-growth momentum. WA recorded the strongest median 1-year capital growth (houses 24.8%, units 31.1%), ahead of the NT and Queensland. New South Wales, Victoria and the ACT were noticeably softer on recent capital growth.
- Queensland, Tasmania and South Australia show the steadiest long-term capital-growth records. On 10-year annualised capital growth, Queensland (8.8%), Tasmania (8.4%) and SA (8.0%) led for houses, while the NT was weakest long term despite strong recent capital-growth figures.
- Main takeaway: the strongest markets for further investigation are those where recent capital-growth momentum, a longer-term capital-growth track record and tight vacancy line up together, most visibly across parts of Queensland. A high capital-growth figure on its own should not be treated as a standalone buy signal.
Introduction
This is the quarterly postcode-level property market report prepared for Aus Investment Properties. It is designed to help residential property investors identify postcode markets worth closer attention, whether the interest is in high-yielding holdings, new turnkey investment property, SMSF-suitable opportunities or off-market options.
The report combines three measures for each postcode market: 1-year capital growth (a measure of recent momentum), 10-year annualised capital growth (a measure of longer-term performance), and the vacancy rate (used here as a rental-demand indicator). Reading these together gives a more balanced view than any single number, because capital growth and rental demand should be assessed together rather than in isolation.
The purpose is to surface postcode markets showing stronger capital growth, tighter rental conditions, or both, and to flag where the signals are mixed or where extreme figures warrant caution. It is intended as a starting point for investor due diligence, not as a list of recommendations.
Recent momentum is concentrated in the west and north. Western Australia points to the strongest recent momentum, with median 1-year growth of 24.8% for houses and 31.1% for units, the only market where unit momentum clearly outran houses. The Northern Territory (houses 23.1%), Queensland (units 22.4%, houses 18.6%), Tasmania and South Australia also recorded double-digit medians. New South Wales (houses 9.2%, units 6.0%) and Victoria (7.9% and 4.7%) were materially softer, and ACT units were the weakest reading on the board at -0.8%.
_1782258016pI4hT.png)
National market snapshot
The charts below summarise how the states and territories compare on recent growth, long-term growth and rental tightness. Vacancy is reported at the postcode level (it is not split by houses and units), so the vacancy chart is a single series per state.
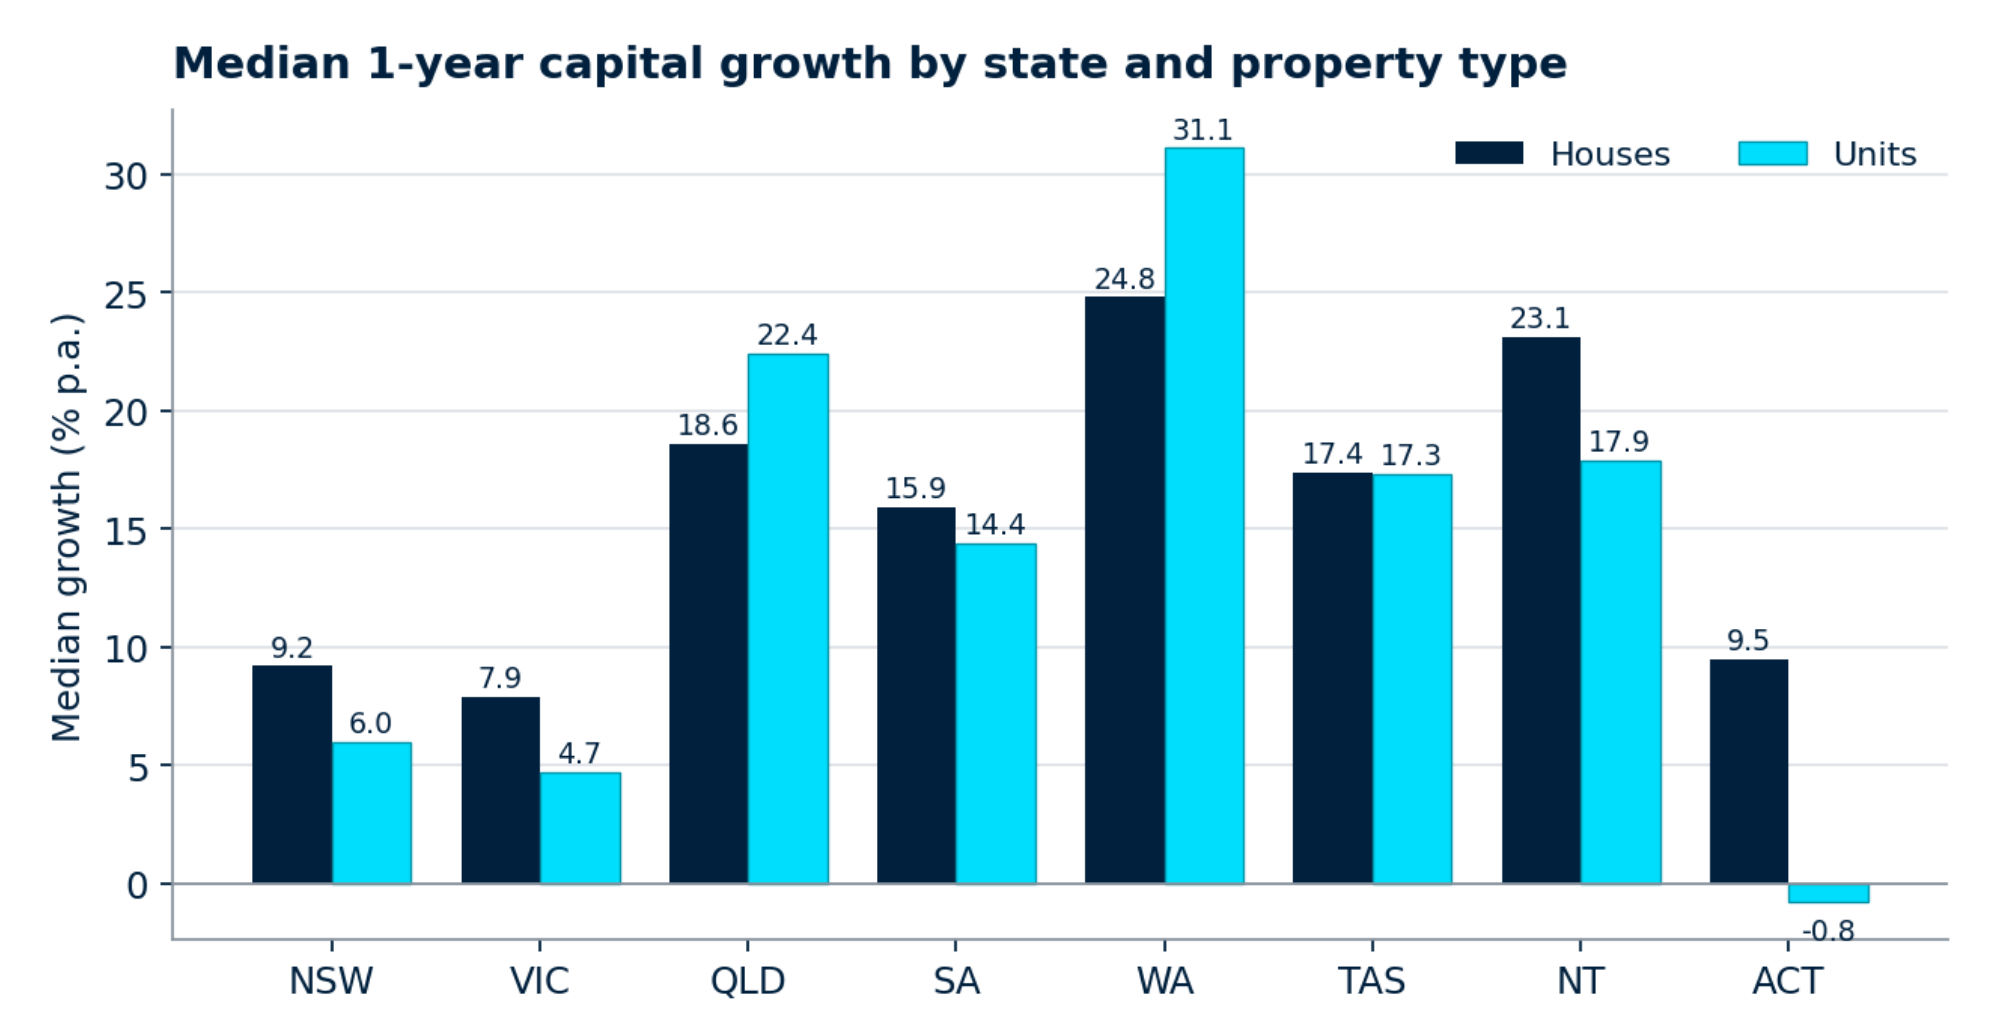
Median 1-year capital growth by state and property type (eligible postcode markets).
Recent momentum is concentrated in the west and north. Western Australia points to the strongest recent momentum, with median 1-year growth of 24.8% for houses and 31.1% for units, the only market where unit momentum clearly outran houses. The Northern Territory (houses 23.1%), Queensland (units 22.4%, houses 18.6%), Tasmania and South Australia also recorded double-digit medians. New South Wales (houses 9.2%, units 6.0%) and Victoria (7.9% and 4.7%) were materially softer, and ACT units were the weakest reading on the board at -0.8%.
Median 10-year annualised growth by state and property type (eligible postcode markets).
The long-term picture reorders the table. On 10-year annualised growth, Queensland (8.8% houses), Tasmania (8.4%) and South Australia (8.0%) show the most consistent records, with New South Wales houses at 7.0%. Western Australia is the clearest divergence: despite leading recent momentum, its 10-year house figure of 5.6% sits mid-pack, which points to a recent surge on a shorter track record rather than a long, steady run. The Northern Territory is weakest long term (1.2% for houses), so its strong 1-year reading should be treated with particular caution. Across almost every state, houses out-performed units over the longer horizon, the unit gap is widest in markets where recent unit momentum has been driven by shorter-term factors.
_1782258080n6efs.png)
Median vacancy rate by state (postcode-level).
_1782258151nG9kZ.png)
Share of postcode markets sitting under 1% vacancy, by state.
Rental conditions are tight across the board, with differences of degree rather than direction. Tasmania (0.4%), the Northern Territory (0.45%) and Western Australia (0.52%) recorded the tightest median vacancy, and in the NT and Tasmania virtually every market sat under 1% (100.0% and 93.3% of markets respectively). Western Australia was close behind at 90.5%. New South Wales and Victoria were the loosest of the group, yet still tight in absolute terms, with median vacancy near 0.96% and around half of their markets under 1%. In short, low vacancy suggests rental-market pressure is a national feature this quarter, which makes the growth differences between states the more useful point of separation.
Where signals are mixed: Western Australia and the NT pair strong momentum and tight vacancy with thinner long-term records; New South Wales and Victoria pair steadier long-term growth and (relatively) looser vacancy with soft recent momentum; Queensland is the market where recent growth, long-term growth and rental tightness most often line up together.
Capital growth leaders
Capital growth leaders
The tables below rank the strongest postcode markets on recent and long-term growth, separately for houses and units. Two cautions apply throughout. First, strong 1-year growth points to recent momentum but should not be treated as a standalone buy signal, momentum can fade, and a single strong year says little about durability. Second, several of the highest 1-year readings sit in broad regional or rural postcodes that cover large areas; these can be more volatile and require additional due diligence even where they clear the market-depth guardrail.
Top 20: highest 1-year growth, houses
Top 20: highest 1-year growth, houses
Top 20: 1-year growth, houses
Recent house momentum is led by Perth growth corridors (for example postcode 6028, covering Burns Beach, Currambine, Iluka and Kinross, at 38.7%, and 6027 around Joondalup at 37.9%) alongside Queensland markets. A useful contrast within this table: postcode 4209 (Coomera, Pimpama, Upper Coomera) pairs strong recent growth with a strong 10-year record, whereas several others show a strong year against a much more modest long-term figure, a sign that momentum, not a long track record, is doing the work.
Top 20: highest 1-year growth, units
Top 20: 1-year growth, units
Unit momentum is heavily weighted to Western Australia and Queensland. Some of these markets carry a clear warning sign for the longer term: inner and middle-ring unit postcodes such as 3039 (Moonee Ponds) and parts of inner Perth record very strong 1-year figures against near-flat 10-year annualised growth. That divergence is exactly where 1-year growth should not be read as a buy signal without testing the longer-term picture and local rental demand.
Top 20: highest 10-year annualised growth, houses
Top 20: 10-year annualised growth, houses
The long-term house leaders are concentrated in South-East Queensland growth corridors and parts of regional New South Wales and Victoria. Where a market appears in both the 1-year and 10-year house tables, the two signals are aligned and the market is more clearly worth further investigation. Where a market appears here but not on the 1-year list, it has a strong history but softer recent momentum. See the cooling long-term performers watchlist in Section 7.
Top 20: highest 10-year annualised growth, units
Top 20: 10-year annualised growth, units
Long-term unit performance is dominated by Gold Coast and Sunshine Coast markets such as Noosa, Burleigh Heads, Palm Beach and the Beenleigh-Coomera corridor, several of which also show strong recent momentum and tight vacancy. This is the part of the unit market where capital growth and rental demand appear best aligned, though coastal markets can carry their own demand cyclicality and warrant local due diligence.
Rental pressure markets
The tightest markets are dominated by regional Queensland, with pockets of regional New South Wales and Tasmania, several recording effectively zero measured vacancy. Encouragingly, many of these also show solid recent and long-term growth (for example the Arana Hills-Keperra area in Brisbane’s north), which is the combination that suggests stronger market depth on the rental side. Where extremely low vacancy sits alongside weak growth, the market belongs on the monitoring list rather than the action list.
Top 20: highest vacancy postcode markets
Rental pressure markets
Vacancy is used here as a rental-demand indicator and is measured at postcode level. Low vacancy can indicate stronger rental demand and pricing power for landlords; high vacancy can indicate rental-market risk. Vacancy should not be assessed in isolation, a very tight market with weak capital growth may still require caution, and a looser market is not automatically a poor one.
Top 20: lowest vacancy postcode markets
Top 20: lowest vacancy postcode markets
Top 20: lowest vacancy
The tightest markets are dominated by regional Queensland, with pockets of regional New South Wales and Tasmania, several recording effectively zero measured vacancy. Encouragingly, many of these also show solid recent and long-term growth (for example the Arana Hills-Keperra area in Brisbane’s north), which is the combination that suggests stronger market depth on the rental side. Where extremely low vacancy sits alongside weak growth, the market belongs on the monitoring list rather than the action list.
Top 20: highest vacancy postcode markets
Top 20: highest vacancy
At the other end, the highest-vacancy markets among those with adequate sales depth still look modest by historical standards, reflecting how tight the national rental market is this quarter. Even so, higher relative vacancy combined with weak price momentum is the profile that requires additional due diligence, these are covered in the high-vacancy-risk watchlist in Section 7.
Balanced growth and rental demand markets
This section screens for markets where the three signals are better aligned: positive 1-year growth, positive 10-year annualised growth, and tighter-than-typical vacancy. Eligible markets are scored with a combined, weighted measure: 35% recent growth, 35% long-term growth and 30% vacancy (inverted, so lower vacancy scores higher), with each component scaled across the eligible pool. The score is a screening tool to shortlist markets for further work, not a recommendation or a ranking of investment quality.
Both balanced lists are heavily weighted to Queensland, with Tasmania (Hobart’s northern suburbs) and Western Australia (the Rockingham area) also featuring. These are the markets where recent momentum, a longer-term record and rental tightness most clearly coincide. That alignment is what makes them worth further investigation, but the score compresses three different risks into one number, so each shortlisted market still needs its own assessment of price level, stock quality, local rental demand and the reliability of the underlying sales sample.
Watchlist markets
These watchlists are practical monitoring lists rather than opportunities. The thresholds used are drawn from this quarter’s data: “low / tight vacancy” means at or below the 25th percentile (0.58%), “high vacancy” means at or above the 75th percentile (1.22%), “strong long-term growth” means a 10-year annualised figure at or above the 75th percentile (8.11%), and “weak or negative recent growth” means 1-year growth at or below 2.0%.
Balanced growth and rental demand markets
This section screens for markets where the three signals are better aligned: positive 1-year growth, positive 10-year annualised growth, and tighter-than-typical vacancy. Eligible markets are scored with a combined, weighted measure: 35% recent growth, 35% long-term growth and 30% vacancy (inverted, so lower vacancy scores higher), with each component scaled across the eligible pool. The score is a screening tool to shortlist markets for further work, not a recommendation or a ranking of investment quality.
Top 20: balanced house markets
Top 20: balanced house markets
Top 20: balanced unit markets
Top 20: balanced unit markets
Both balanced lists are heavily weighted to Queensland, with Tasmania (Hobart’s northern suburbs) and Western Australia (the Rockingham area) also featuring. These are the markets where recent momentum, a longer-term record and rental tightness most clearly coincide. That alignment is what makes them worth further investigation, but the score compresses three different risks into one number, so each shortlisted market still needs its own assessment of price level, stock quality, local rental demand and the reliability of the underlying sales sample.
Watchlist markets
These watchlists are practical monitoring lists rather than opportunities. The thresholds used are drawn from this quarter’s data: “low / tight vacancy” means at or below the 25th percentile (0.58%), “high vacancy” means at or above the 75th percentile (1.22%), “strong long-term growth” means a 10-year annualised figure at or above the 75th percentile (8.11%), and “weak or negative recent growth” means 1-year growth at or below 2.0%.
Rental pressure without price momentum
Tight vacancy, weak or negative 1-year growth
These markets have tight rental conditions, but price momentum has not yet followed. They may be worth monitoring, but should not be treated as automatic opportunities, tight vacancy alone does not guarantee capital growth will arrive.
Cooling long-term performers
Strong 10-year growth, weak or negative 1-year growth
These markets have historically performed well but may be losing short-term momentum. A strong long-term record does not guarantee the next year, and a soft recent reading is a prompt to check what has changed locally rather than to assume mean reversion.
High vacancy risk markets
Higher vacancy, weak or negative 1-year growth
These markets combine higher relative vacancy with weak price momentum and may require additional due diligence before being considered. The combination can reflect oversupply, softer local demand, or both, each of which materially affects rental income assumptions.
House versus unit comparison
Where both house and unit records exist for the same postcode (171 postcode markets this quarter), the two can diverge materially, so “the postcode” is rarely a single market. The tables below show the largest gaps in each direction. A positive difference means houses out-performed units; a negative difference means units out-performed houses.
Units outperform houses: 10-year annualised growth
House versus unit comparison
Where both house and unit records exist for the same postcode (171 postcode markets this quarter), the two can diverge materially, so “the postcode” is rarely a single market. The tables below show the largest gaps in each direction. A positive difference means houses out-performed units; a negative difference means units out-performed houses.
Houses outperform units: 1-year growth
Largest house-over-unit gap, 1-year growth
Units outperform houses: 1-year growth
Largest unit-over-house gap, 1-year growth
Houses outperform units: 10-year annualised growth
Largest house-over-unit gap, 10-year annualised growth
Units outperform houses: 10-year annualised growth
Largest unit-over-house gap, 10-year annualised growth
The clearest pattern is how often houses and units in the same postcode move differently, in some inner-urban postcodes, houses recorded solid gains while units fell over the same period. The practical point is that property-type selection within a postcode can matter as much as the choice of postcode itself, and the headline postcode figure can mask a very different result for the dwelling type an investor is actually considering.
Investor implications
Investor implications
Reading this quarter as a whole, a few themes carry the most weight for investors assessing residential opportunities across Australia, including off-market and turnkey options.
Rental tightness is doing a lot of work. With the large majority of markets under 1% vacancy, low vacancy is close to a baseline condition this quarter rather than a point of difference. That raises the bar on the other signals: when almost everywhere is tight, capital growth quality and long-term consistency become the more useful ways to separate markets.
Long-term consistency and recent momentum are not the same thing. The states leading recent growth (Western Australia, the Northern Territory) are not the same as those with the steadiest 10-year records (Queensland, Tasmania, South Australia). Markets where both align (most often in parts of Queensland) are more clearly worth further investigation, while strong 1-year figures sitting on thin long-term records require additional due diligence.
Market depth and data reliability matter before any figure is trusted. Every market in this report cleared a minimum settled-sales threshold, which removes the worst thin-market distortion, but depth still varies and some leading figures sit in broad rural postcodes. A growth result is only as reliable as the number of sales behind it, and high-growth results in particular need to be tested against market depth before they influence a decision.
House versus unit selection is a decision in its own right. Houses led on both horizons nationally and the house-unit gap was widest over the long term, but the same-postcode comparisons show units out-performing in specific markets. The right answer is market-specific, and the postcode headline should not be assumed to apply to the dwelling type under consideration.
No single metric should drive a decision. Recent growth, long-term growth and vacancy each capture part of the picture and can point in different directions. The markets that screen well here are a starting point for work, not a substitute for it. Property selection, an independent rental assessment and local due diligence still determine whether a market that looks attractive in the data is suitable in practice.
Executive summary
Executive summary
Across 899 postcode markets with adequate sales depth (627 house markets and 272 unit markets, spanning every state and territory), this was a growth-led quarter underpinned by unusually broad rental tightness. Median 1-year growth was 12.6% with only 10.6% of markets falling, median 10-year annualised growth was 6.4%, and median vacancy was 0.86% with 62.5% of markets under 1%.
At the state level, Western Australia, the Northern Territory and Queensland led recent momentum, while Queensland, Tasmania and South Australia showed the most consistent 10-year records. The standout divergence was Western Australia, which combined the strongest recent growth with only a mid-pack long-term figure, and the Northern Territory, whose strong recent reading sits on the weakest long-term record. New South Wales and Victoria were softer on recent growth but steadier over the longer term.
On growth versus vacancy, the near-universal tightness (tightest in Tasmania, the NT and WA) means vacancy separates markets less than usual this quarter; capital-growth quality is the sharper differentiator. On houses versus units, houses led on both horizons (a median 12.9% versus 11.2% over one year and 7.1% versus 3.6% annualised over ten), though same-postcode comparisons show units leading in specific markets. The balanced screen, which rewards alignment across all three signals, was dominated by Queensland, with Tasmania and Western Australia also featuring.
The key cautions: several headline 1-year figures rest on broad rural postcodes and short long-term records; tight vacancy is a baseline condition rather than a differentiator; and a strong single-year result is not a buy signal on its own. The practical takeaway is to prioritise markets where recent momentum, a longer-term track record and rental tightness coincide, and to treat the rankings here as a shortlist for due diligence rather than a conclusion.
Methodology and data guardrails
Methodology and data guardrails
This report uses postcode-level growth and vacancy data. For each postcode market (a postcode and property type), 1-year growth measures recent capital-growth momentum, 10-year annualised growth measures longer-term capital-growth performance, and the vacancy rate is used as a rental-demand indicator. Vacancy is provided at postcode level and is therefore the same for houses and units within a postcode.
State is derived from the postcode, cross-checked against the supplied postcode-to-locality reference. Locality names are included for readability only and are cleaned by removing postal, commercial and facility-style entries (for example Delivery Centre, PO box, business centre and shopping-centre names), correcting capitalisation, de-duplicating, applying title case, and showing up to five key localities per postcode; where no clean locality remains, the market is shown as “Locality not available”.
Market-depth guardrail
Market-depth guardrail
The market data was first filtered to remove thin markets. In place of a minimum-dwellings rule, this report uses the settled-sales counts that were available: a postcode market is included only where it recorded at least 30 settled sales in each of the two comparison quarters. This is a direct measure of transaction depth and is the stronger of the two approaches, a minimum-dwellings threshold is only a proxy for depth, used when settled-sales counts are not available. Because settled-sales counts were available here, the proxy was not required.
Extreme-growth cap
After the depth filter, any postcode recording 1-year growth above 40% in either houses or units was excluded from the headline rankings at the postcode level. This removed 9 postcodes and is designed to keep extreme single-year observations out of the leader tables. The depth filter and the growth cap are documented in the excluded dataset accompanying this report.
- Postcode markets with fewer than 30 settled sales in either quarter are excluded (market-depth guardrail).
- Postcodes with 1-year growth above 40% in either property type are excluded from headline rankings (extreme-growth cap).
- The 30-settled-sales threshold is a direct transaction-depth measure; the 300-dwelling rule is only a proxy used when sales counts are unavailable.
Disclaimer To give this report credibility, postcode markets with fewer than 30 settled sales in a quarter have been excluded, so that every figure reflects a market with genuine transaction depth rather than a small number of isolated sales. Postcodes recording one-year growth above 40% were also held out of the headline rankings, to keep extreme single-year movements from distorting the leader tables.
This report is general information only and does not constitute financial, legal, taxation, credit, investment or superannuation advice. It does not take account of any individual’s circumstances or objectives, and the market data should be used only as a starting point for further due diligence. Investors should seek advice from appropriately qualified professionals before making any investment decision.
Figures are derived solely from the supplied datasets for the stated periods and are subject to the data limitations described in the methodology. Past performance is not a reliable indicator of future performance.


_1776213150EC5td.jpg)
-(1)_17762144417K00n.png)
_1776214724iUydB.png)