Introduction
This report provides a quarterly review of pricing across current market listings analysed by Aus Investment Properties. It is designed as an investor-grade market snapshot of build pricing, land pricing and package pricing across residential investment product types and key states. Unless otherwise stated, all standard residential analysis excludes Specialist Disability Accommodation (SDA) and Commercial property, each of which is reported separately. SDA differs materially from standard residential stock in specification, compliance settings and package structure, while Commercial is a distinct asset class with different valuation, tenancy and lease fundamentals. Both are therefore excluded from the residential category, regional, state and national figures and covered in their own sections.
Overview
Based on listings tracked by Aus Investment Properties, average category-level build pricing was $2,652 per square metre in October 2026. That was slightly lower quarter-on-quarter (-1.7% against June 2026) and only +1.1% higher than October 2025, indicating that construction pricing has been broadly stable over the past twelve months. Average land pricing was the clear mover. On the same category-average basis, land reached $1,044 per square metre, up +2.5% from June 2026 and +23.0% year-on-year. Average package pricing was $1,068,240, +0.6% quarter-on-quarter and +9.8% above October 2025. The composition of these movements is consistent with the June 2026 report: with build rates steady, land is the dominant driver of package price growth across the current listing set.
Base effects and mix shifts are important this quarter. The three datasets differ substantially in size and product mix. The October 2026 listing set is the largest of the three, with 5,822 core residential listings analysed, compared with 4,351 listings in the June 2026 regional build table and 1,605 core residential listings in October 2025. The October 2025 dataset was dominated by Apartment stock (1,064 listings) and carried only 27 Dual Key listings, against 490 in October 2026. Victoria accounts for 53.7% of the October 2026 build sample, up from 49.3% in June 2026 but down from 64.0% in October 2025. Because Victoria is the lowest-cost state on build and package pricing, these shifts move several category and state averages independently of any like-for-like repricing. In addition, the national figures are a simple average of six category figures, so the two smallest categories (Duplex and Rooming House) carry the same weight as House and Land, which represents three-quarters of the core residential listings this quarter.
Key National Statistics
National Statistics
| Metric | Oct 2025 | Jun 2026 | Oct 2026 | QoQ Change | YoY Change |
|---|
| Average build price per square metre | $2,622 | $2,697 | $2,652 | -1.7% | +1.1% |
| Average land price per square metre | $849 | $1,018 | $1,044 | +2.5% | +23.0% |
| Average package price | $972,532 | $1,061,707 | $1,068,240 | +0.6% | +9.8% |
The headline picture is one of stable construction pricing, materially higher land values and steady package growth. Over the year, build pricing rose +1.1% while land pricing rose +23.0%, so land accounts for most of the +9.8% year-on-year increase in package pricing. On a quarterly basis, build eased slightly while land and package pricing were marginally higher, with the quarterly land increase concentrated in Rooming House and Duplex rather than spread across all categories.
Build Price per Square Metre by Property Category
Build $ per m2 by Category
| Property Type | Oct 2025 | Jun 2026 | Oct 2026 | QoQ Change | YoY Change |
|---|
| Co-living | $2,292 | $2,403 | $2,461 | +2.4% | +7.3% |
| Dual Key | $2,552 | $2,706 | $2,372 | -12.3% | -7.0% |
| Dual Occupancy | $3,130 | $2,636 | $2,592 | -1.7% | -17.2% |
| Duplex | $2,786 | $2,986 | $2,949 | -1.2% | +5.9% |
| House and Land | $2,298 | $2,641 | $2,471 | -6.4% | +7.6% |
| Rooming House | $2,675 | $2,808 | $3,064 | +9.1% | +14.6% |
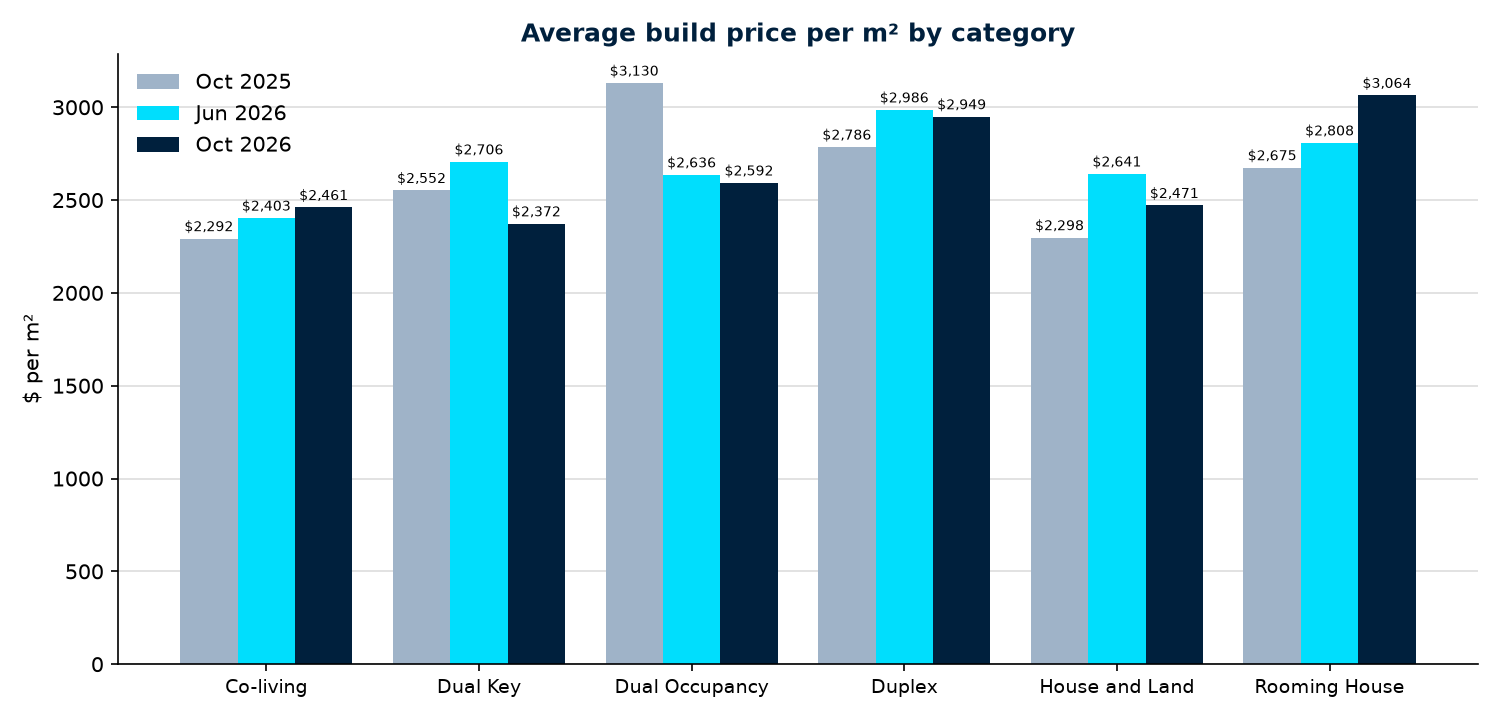
Rooming House recorded the strongest build movements, at +9.1% quarter-on-quarter and +14.6% year-on-year, although it is measured on 48 listings in October 2026 and 14 in October 2025 and is sensitive to the Queensland and Victorian mix within those small samples. Co-living firmed +2.4% quarter-on-quarter and was +7.3% higher than October 2025. House and Land, by far the largest category, eased -6.4% to $2,471 per square metre against June 2026 but remained +7.6% above October 2025, a broad-based annual signal given its sample size. The quarterly fall largely reflects mix: Victorian listings make up 53.0% of the House and Land build sample this quarter, at an average of $2,303 per square metre, compared with $2,524 in Queensland and $2,842 in New South Wales.
Dual Key fell -12.3% quarter-on-quarter and -7.0% year-on-year. Victoria accounts for 349 of the 480 Dual Key listings with build data, at an average of $2,206 per square metre, whereas the October 2025 Dual Key figure was drawn from only 22 listings, mostly in New South Wales. The movement therefore reflects a shift toward lower-cost Victorian product rather than a broad reduction in construction costs. Dual Occupancy eased -1.7% against June 2026 and was -17.2% below October 2025, a clear base effect: the October 2025 average ($3,130 per square metre) sat well above its median ($2,679), indicating that a group of higher-rate listings lifted the year-ago figure. Duplex was broadly steady quarter-on-quarter (-1.2%) and +5.9% higher year-on-year.
Land Price per Square Metre by Property Category
Land $ per m2 by Category
| Property Type | Oct 2025 | Jun 2026 | Oct 2026 | QoQ Change | YoY Change |
|---|
| Co-living | $873 | $881 | $896 | +1.8% | +2.6% |
| Dual Key | $721 | $1,001 | $975 | -2.6% | +35.2% |
| Dual Occupancy | $581 | $1,001 | $962 | -3.9% | +65.5% |
| Duplex | $846 | $863 | $979 | +13.4% | +15.7% |
| House and Land | $1,086 | $1,248 | $1,156 | -7.3% | +6.5% |
| Rooming House | $986 | $1,112 | $1,293 | +16.3% | +31.2% |
Land pricing was higher year-on-year in every category. The largest annual increases were in Dual Occupancy (+65.5%), Dual Key (+35.2%) and Rooming House (+31.2%), all consistent with a change in the lot and location mix rather than a uniform national land trend. The October 2025 Dual Occupancy land sample was drawn entirely from Queensland and New South Wales, on larger lots (median 806 square metres, against 480 square metres in October 2026), which produced a low average land rate of $581 per square metre. House and Land land pricing was +6.5% higher year-on-year but eased -7.3% quarter-on-quarter to $1,156 per square metre, consistent with the larger Victorian weighting in the current listing set (Victorian House and Land land averaged $1,053 per square metre, against $1,257 in Queensland and $1,517 in New South Wales). On a quarterly basis, the national land increase of +2.5% was driven by Rooming House (+16.3%) and Duplex (+13.4%), both small samples in which a handful of better-located lots can move the average materially. Because these are listing-based averages, category-level land movements are best interpreted alongside shifts in lot size and location.
Average Package Price by Property Category
Package Price by Category
| Property Type | Oct 2025 | Jun 2026 | Oct 2026 | QoQ Change | YoY Change |
|---|
| Co-living | $812,993 | $838,149 | $913,231 | +9.0% | +12.3% |
| Dual Key | $973,608 | $1,008,728 | $914,368 | -9.4% | -6.1% |
| Dual Occupancy | $960,007 | $1,037,256 | $1,038,974 | +0.2% | +8.2% |
| Duplex | $1,019,090 | $1,429,005 | $1,372,148 | -4.0% | +34.6% |
| House and Land | $803,558 | $887,369 | $853,427 | -3.8% | +6.2% |
| Rooming House | $1,265,937 | $1,169,734 | $1,317,293 | +12.6% | +4.1% |
| Apartment | $1,283,313 | $914,247 | $1,011,087 | +10.6% | -21.2% |
| Townhouse/Unit | $852,937 | $1,199,771 | $946,880 | -21.1% | +11.0% |
Package pricing remained highest in Duplex ($1,372,148) and Rooming House ($1,317,293), the two categories with the strongest sensitivity to compositional shifts. Duplex package pricing eased -4.0% quarter-on-quarter but was +34.6% above October 2025, when the category average was drawn from a lower-priced mix (median $869,990). Co-living package pricing rose +9.0% quarter-on-quarter and +12.3% year-on-year to $913,231. Rooming House package pricing rose +12.6% quarter-on-quarter and +4.1% year-on-year. House and Land package pricing eased -3.8% to $853,427 against June 2026 and was +6.2% higher year-on-year, driven primarily by the land component identified above. Dual Key package pricing fell -9.4% quarter-on-quarter and -6.1% year-on-year, reflecting the same shift toward Victorian Dual Key stock identified in the build analysis. Dual Occupancy was steady quarter-on-quarter (+0.2%) and +8.2% higher year-on-year.
The newer residential categories should be read with their data limitations in mind. Apartment package pricing rose +10.6% to $1,011,087 against June 2026 but was -21.2% below October 2025. This is largely a base effect: the October 2025 dataset was heavily weighted to apartment stock (1,064 listings, predominantly higher-priced foreign-investment-review and SMSF single-contract product), against 282 listings in October 2026 concentrated in New South Wales (141) and the Australian Capital Territory (86). Townhouse/Unit package pricing fell -21.1% quarter-on-quarter to $946,880 but was +11.0% higher year-on-year, across 238 listings predominantly in Victoria (139) and Queensland (77).
Average Build Price per Square Metre by Region
Build $ per m2 by Region
| Region | Oct 2025 | Jun 2026 | Oct 2026 | QoQ Change | YoY Change | Oct 2026 Listings Analysed |
|---|
| Tasmania | n/a | $3,333 | $3,291 | -1.3% | n/a | 60 |
| South Australia | $2,553 | $3,074 | $2,939 | -4.4% | +15.1% | 171 |
| New South Wales | $3,081 | $2,837 | $2,882 | +1.6% | -6.5% | 566 |
| Western Australia | $2,257 | $2,863 | $2,844 | -0.7% | +26.0% | 203 |
| Northern Territory | n/a | $2,742 | $2,742 | 0.0% | n/a | 4 |
| Queensland | $2,500 | $2,526 | $2,578 | +2.1% | +3.1% | 1,504 |
| Victoria | $2,197 | $2,528 | $2,296 | -9.2% | +4.5% | 2,908 |
On the October 2026 listing set, Tasmania again recorded the highest average build pricing at $3,291 per square metre, although on a smaller listing count (60) than in June 2026. South Australia, New South Wales and Western Australia followed, each within a relatively narrow band of $2,844 to $2,939 per square metre. Queensland and Victoria again recorded the lowest average build pricing while representing the two largest current-quarter samples, at 1,504 and 2,908 listings respectively. Victoria fell -9.2% quarter-on-quarter but was +4.5% higher year-on-year. Western Australia (+26.0%) and South Australia (+15.1%) recorded the largest annual increases, while New South Wales was -6.5% lower than an elevated October 2025 reading. The Northern Territory figure is based on only four listings, unchanged from June 2026, and should be treated as indicative only; Tasmania and the Northern Territory had fewer than 10 listings analysed in October 2025, so no year-on-year comparison is shown. The Australian Capital Territory is not shown because current ACT listings are Apartment product, which is reported on package price only.
State-by-State Pricing Breakdown
State comparison is presented for the four states carried in the established series (New South Wales, Queensland, Victoria and Western Australia). October 2026 results show steady build pricing in New South Wales, Queensland and Western Australia, a pull-back in Victorian build pricing against June 2026, materially higher land pricing than a year ago in every state except Victoria, and a partial reversal of the sharp June 2026 rise in New South Wales land pricing.
Build $ per m2 by State
| State | Oct 2025 | Jun 2026 | Oct 2026 | QoQ Change | YoY Change |
|---|
| New South Wales | $3,081 | $2,837 | $2,882 | +1.6% | -6.5% |
| Queensland | $2,500 | $2,526 | $2,578 | +2.1% | +3.1% |
| Victoria | $2,197 | $2,528 | $2,296 | -9.2% | +4.5% |
| Western Australia | $2,257 | $2,863 | $2,844 | -0.7% | +26.0% |
Queensland (+2.1%) and New South Wales (+1.6%) recorded modest quarterly increases in build pricing, and Western Australia was steady (-0.7%). Victoria eased -9.2% to $2,296 per square metre, reversing the +12.5% increase reported in June 2026, but remained +4.5% above October 2025. The Victorian build sample expanded from 2,147 listings in June 2026 to 2,908, with the additional stock weighted toward lower-cost House and Land and Dual Key product, so the quarterly movement is best read as a base effect against an elevated June reading. Western Australia's +26.0% annual increase reflects a year-ago base of only 21 listings, and New South Wales was -6.5% below an October 2025 figure that was lifted by a higher-rate mix.
Land $ per m2 by State
| State | Oct 2025 | Jun 2026 | Oct 2026 | QoQ Change | YoY Change |
|---|
| New South Wales | $1,124 | $1,784 | $1,383 | -22.5% | +23.1% |
| Queensland | $908 | $1,244 | $1,223 | -1.7% | +34.7% |
| Victoria | $980 | $974 | $1,011 | +3.8% | +3.2% |
| Western Australia | $869 | $1,200 | $1,214 | +1.2% | +39.7% |
New South Wales land pricing eased -22.5% to $1,383 per square metre, following the +39.8% quarterly increase reported in June 2026, but remained +23.1% above October 2025. This suggests that the June reading was elevated by the lot and location mix at that time, within an otherwise rising annual trend. Queensland (+34.7%) and Western Australia (+39.7%) recorded the largest annual land increases, while Victoria was +3.2% higher year-on-year and +3.8% higher quarter-on-quarter. Movements of this magnitude are strongly influenced by lot size and location mix within each state's listing set and should not be read as uniform state-wide land price changes.
Package Price by State
| State | Oct 2025 | Jun 2026 | Oct 2026 | QoQ Change | YoY Change |
|---|
| New South Wales | $1,105,710 | $1,254,858 | $1,191,169 | -5.1% | +7.7% |
| Queensland | $997,630 | $1,060,950 | $1,033,045 | -2.6% | +3.5% |
| Victoria | $741,294 | $758,408 | $767,158 | +1.2% | +3.5% |
| Western Australia | $769,215 | $1,054,288 | $1,007,410 | -4.4% | +31.0% |
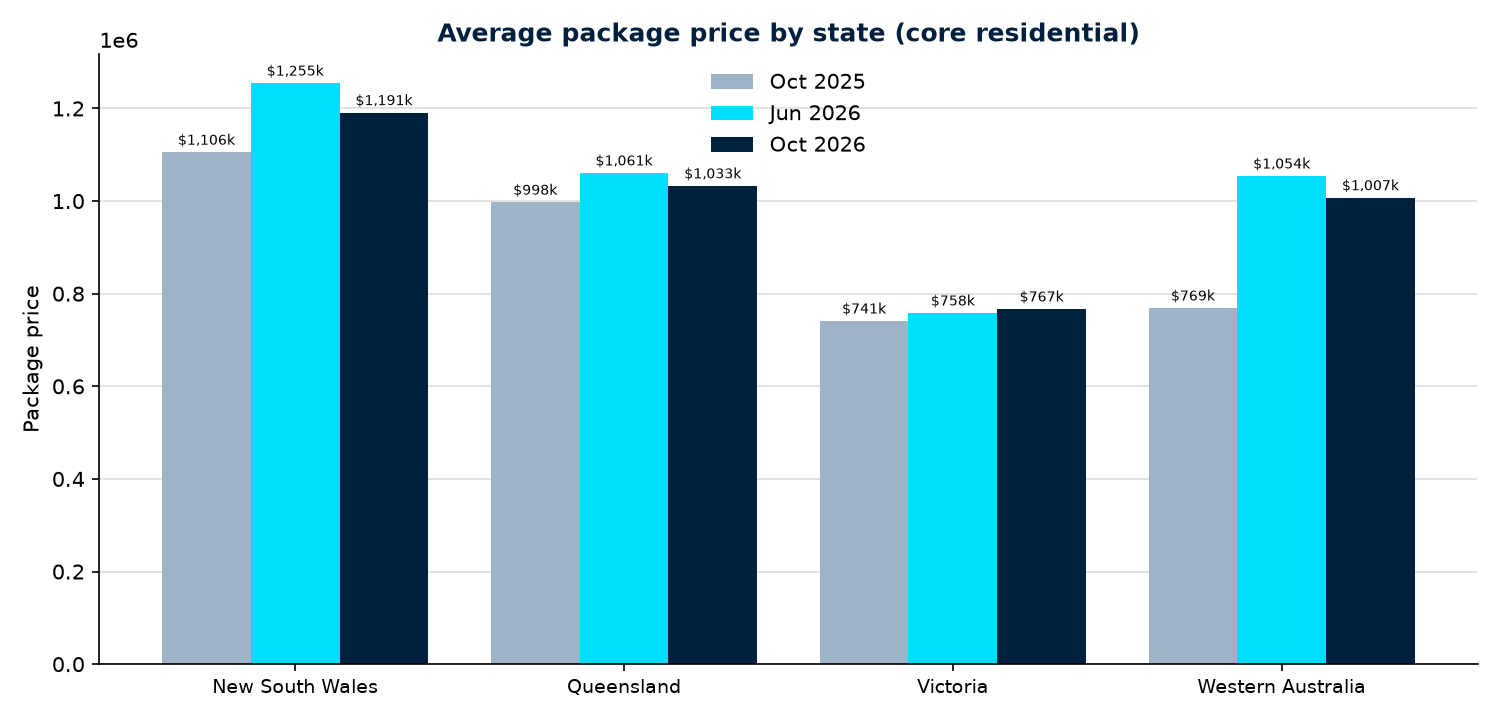
New South Wales remained the most expensive state on a package basis at $1,191,169, -5.1% quarter-on-quarter in line with its lower land reading but +7.7% above October 2025. Western Australia was +31.0% higher year-on-year, on a small year-ago base of 34 listings, and Queensland +3.5%, although both eased against their June 2026 levels. Victoria remained the lowest-cost state on build, land and package pricing among the four states, and was the only one of the four to record a higher package average this quarter (+1.2% to $767,158, +3.5% year-on-year), reinforcing its position as the value end of the current listing set.
SDA Pricing Overview
SDA is reported separately because it can materially distort broader residential averages. Based on listings tracked by Aus Investment Properties, the October 2026 SDA subset comprised 15 listings (11 in Victoria), 11 of which carried complete build and land data.
Average October 2026 SDA build pricing was $4,214 per square metre, +0.5% higher than June 2026 and well above standard residential category averages. The average SDA land price was $980 per square metre (-5.2%), and the average SDA package price was $1,291,083 (+7.3%), with an observed package range of $968,990 to $2,080,400. The two highest-priced SDA listings do not carry a separate build and land split and are therefore included in the package figures only; excluding them, the average package price would be $1,176,388, slightly below June 2026, and the SDA package median was $1,177,685. Against October 2025, SDA build pricing was +43.6% higher and package pricing +34.0% higher, while land pricing was broadly unchanged (+0.7%). The October 2025 SDA subset was larger (40 listings, 38 with build data) and made up largely of lower-rate Victorian product (averaging $2,709 per square metre for build), so the year-on-year movements should be read with particular caution.
SDA Pricing Overview
| Metric | Oct 2025 | Jun 2026 | Oct 2026 | QoQ Change | YoY Change |
|---|
| Listings analysed (build) | 38 | 12 | 11 | n/a | n/a |
| Average build price per square metre | $2,935 | $4,193 | $4,214 | +0.5% | +43.6% |
| Average land price per square metre | $973 | $1,034 | $980 | -5.2% | +0.7% |
| Average package price | $963,157 | $1,203,415 | $1,291,083 | +7.3% | +34.0% |
| Package price range | $813,199 to $1,190,000 | $908,000 to $1,764,320 | $968,990 to $2,080,400 | n/a | n/a |
Base effects are particularly important in SDA because each period can contain a small number of highly specialised dwellings. Period-to-period movement can therefore reflect design and dwelling mix as much as market repricing.
Commercial Pricing Overview
Commercial property is reported separately from the residential analysis because it is a distinct asset class, with pricing driven by tenancy, lease terms and yield rather than by the build and land fundamentals that shape residential packages. Commercial listings are priced at a whole-asset level and do not carry a separate, comparable per-square-metre construction rate or land component in the current data, so commercial pricing is reported on package price only. October 2026 provides the first quarter-on-quarter comparison for the segment; there were no Commercial listings in the October 2025 dataset, so no year-on-year comparison is available.
Commercial Pricing Overview
| Metric | Jun 2026 | Oct 2026 | QoQ Change |
|---|
| Listings analysed | 55 | 94 | n/a |
| Average package price | $734,880 | $765,564 | +4.2% |
| Median package price | $884,000 | $824,760 | -6.7% |
| Package price range | $203,500 to $1,239,000 | $235,000 to $1,239,040 | n/a |
Based on 94 listings analysed (87 in Victoria and seven in New South Wales), average commercial package pricing was $765,564 in October 2026, +4.2% higher than June 2026, across a range of $235,000 to $1,239,040. The median eased -6.7% to $824,760 and continues to sit above the average, indicating a cluster of lower-priced listings that pulls the mean down. The sample has grown from 55 to 94 listings, so the quarterly movement reflects an expanded and differently composed listing set, and these figures should continue to be read as an indicative baseline.
Investor Outlook
The October 2026 data points to a market in which construction pricing has steadied while land has become the primary driver of package price growth. Build rates were broadly flat both quarter-on-quarter and year-on-year at the national level, yet land pricing was +23.0% higher than October 2025, with increases in every core category and in New South Wales, Queensland and Western Australia land values.
For investors, the most important read-through is that headline package movements should continue to be tested against their underlying build and land components and against the mix of stock being measured. Over the year, much of the increase in package pricing is attributable to land rather than construction cost. This quarter, the larger Victorian weighting in the listing set lowered the House and Land, Dual Key and Victorian averages without evidence of a broad fall in replacement costs, and the partial reversal in New South Wales land pricing indicates that a single quarter's movement in a state land average can be driven largely by lot and location mix. Where prices have fallen year-on-year, most notably in Apartment pricing, the move is heavily influenced by a change in the mix of stock being tracked rather than a like-for-like decline.
Near-term pricing risk remains concentrated in land and in higher-specification or thinly-sampled product types, including Duplex, Rooming House, the separately reported SDA and Commercial segments, and the Apartment and Townhouse/Unit categories, where limited history warrants caution. Investors should continue to assess location quality, land efficiency, dwelling specification and end-demand fundamentals, and use state and category-specific figures rather than national averages when assessing feasibility.
Aus Investment Properties offers Australia's largest selection of off-market investment properties. Please visit www.ausinvestmentproperties.com.au to search, research and secure your investment property.
Methodology and Data Notes
All figures are derived only from current market listings analysed by Aus Investment Properties across three point-in-time datasets: October 2026 (current quarter, listing export taken on 26 October 2026), June 2026 (previous quarter) and October 2025 (same quarter last year). The data represents listings tracked by Aus Investment Properties and does not constitute a portfolio, a set of sales results, or a valuation.
Sample definition. All unsold listings in each dataset were retained, including listings not currently displayed publicly on the website, listings that require a member login and listings with an expression of interest submitted, as each remains a listing tracked by Aus Investment Properties. The October 2026 export contained 6,981 listings, all recorded as unsold. The October 2025 dataset contained 3,108 listings, of which 232 were recorded as sold and excluded, leaving 2,876. Listings were assigned to a single category from their property type tags (with the property status field used where the October 2026 type was blank), with SDA tags (including High Physical Support and NDIS-tagged SDA dwellings) and Commercial tags taking precedence. Listings tagged both House and Land and Co-living are classified as Co-living. Where House and Land appears alongside a more specific product type, the more specific type is used, and only listings tagged House and Land without another product type are classified as House and Land. The full order of precedence after SDA and Commercial is Rooming House, Co-living, Dual Key (including Flexi Living), Dual Occupancy, Duplex, House and Land, Apartment and Townhouse/Unit (which includes townhouse, terrace and villa product). Listings that could not be assigned to a reported category (mainly listings with no property type, plus Traditional Home, SMSF-only and display home tags) were excluded: 530 in October 2026 and 21 in October 2025.
Calculations. Build price per square metre is calculated as build price divided by internal building area, averaged across listings. Land price per square metre is calculated as land price divided by land area, averaged across listings. Package price is the average advertised package price. Category, regional and state averages are calculated across listings with complete pricing and size data for the relevant measure. Regional and state figures are calculated on the six core residential categories. National figures are the average of the six core residential category figures (Co-living, Dual Key, Dual Occupancy, Duplex, House and Land and Rooming House) and are presented on this basis to preserve comparability with prior reports. Percentage changes are calculated from unrounded October 2026 and October 2025 figures, and against the rounded figures published for June 2026.
Listings Analysed by Category
| Property Type | Oct 2025 Listings | Oct 2026 Listings | Oct 2026 Build $/m² Sample | Oct 2026 Land $/m² Sample | Oct 2025 Build $/m² Sample | Oct 2025 Land $/m² Sample |
|---|
| Co-living | 283 | 325 | 284 | 275 | 254 | 254 |
| Dual Key | 27 | 490 | 480 | 480 | 22 | 22 |
| Dual Occupancy | 121 | 394 | 346 | 346 | 100 | 101 |
| Duplex | 84 | 171 | 145 | 141 | 35 | 35 |
| House and Land | 1,062 | 4,374 | 4,114 | 4,054 | 983 | 985 |
| Rooming House | 28 | 68 | 48 | 48 | 14 | 14 |
| Apartment | 1,064 | 282 | Not reported | Not reported | Not reported | Not reported |
| Townhouse/Unit | 146 | 238 | Not reported | Not reported | Not reported | Not reported |
| SDA | 40 | 15 | 11 | 11 | 38 | 38 |
| Commercial | 0 | 94 | Not reported | Not reported | Not reported | Not reported |
Data-quality exclusions. Consistent with the June 2026 report, listings with an implied land rate above $20,000 per square metre were treated as data-entry errors and excluded from land calculations. This affected two listings in the October 2026 dataset (one Queensland and one Victorian House and Land listing) and none in October 2025. A matching screen was applied to build pricing in both periods: implied build rates below $500 or above $10,000 per square metre were treated as data-entry errors (for example, placeholder build prices of $5,500 or internal areas recorded below 20 square metres) and excluded from build calculations. This affected 10 core residential listings in October 2026 (nine House and Land and one Duplex) and none in October 2025; it lowers the October 2026 national build average by approximately $12 per square metre relative to an unfiltered calculation. Package figures are reported without exclusions. Listings without complete build or land data are included in package figures only.
Comparison periods. To maintain continuity of the published series, the June 2026 columns reproduce the figures published in the June 2026 Quarterly Investment Property Pricing Report. The October 2025 columns are calculated from the October 2025 listing dataset using the same methodology as October 2026, so that the year-on-year comparison is like-for-like. The October 2025 Quarterly Property Report used an earlier format that published build pricing only, on a different national basis. The recalculated October 2025 category build figures are within 1.5% of the published figures for Co-living, Dual Occupancy, Duplex and House and Land; the differences are larger for Dual Key (-3.6%, a 22-listing sample) and SDA (+5.9%), reflecting the category assignment and sold-listing treatment applied here.
Oct 2025 Published vs Computed
| Property Type | Oct 2025 Published Build $/m² | Oct 2025 Computed Build $/m² | Difference | Oct 2025 Build Sample |
|---|
| Co-living | $2,260 | $2,292 | +1.4% | 254 |
| Dual Key | $2,648 | $2,552 | -3.6% | 22 |
| Dual Occupancy | $3,121 | $3,130 | +0.3% | 100 |
| Duplex | $2,760 | $2,786 | +0.9% | 35 |
| House and Land | $2,298 | $2,298 | 0.0% | 983 |
| SDA | $2,771 | $2,935 | +5.9% | 38 |
Newer categories. Apartment and Townhouse/Unit are reported on package price, consistent with June 2026, because their listings generally do not carry a separate, comparable construction rate or land component. Commercial property is a distinct, non-residential asset class and is reported separately; the October 2025 dataset contained no Commercial listings.
Interpretation. Sample sizes vary materially across the three periods, and several categories and states are measured on modest counts. Movements in smaller segments, including Dual Key (in October 2025), Duplex, Rooming House, SDA, Commercial and the newer categories, should be read as indicative and can reflect dwelling mix, lot size and location rather than a uniform market trend. Category and state figures are simple averages of per-listing rates and can be pulled by a small number of atypical or high-specification listings. In October 2026 House and Land, for example, the average build rate of $2,471 per square metre sits above the median of $2,357, and the average land rate of $1,156 per square metre sits above the median of $1,129. Regional October 2025 figures are shown only where at least 10 listings were analysed.
Disclaimer
This report is based on data analysed by Aus Investment Properties as at October 2026, June 2026 and October 2025. The analysis reflects pricing identified from current market listings at each point in time and does not represent a valuation, forecast or recommendation for any individual property. Figures are listing-based averages that can be affected by changes in the volume, specification and mix of listings tracked in each period. While reasonable care has been taken in preparing this report, readers should undertake their own due diligence and obtain independent professional advice before making investment decisions.
 By Aus Investment Properties